
In this Article:
Try Kanbanchi now
Start your free trial


If you use Google Workspace for daily work, the natural question is: Does Google have a Gantt chart? The practical answer is no, not as a dedicated project management feature.
Google Workspace includes excellent collaboration tools like Google Drive, Docs, Sheets, Calendar, Gmail, and Meet. However, it does not include a native Gantt chart app designed for managing project schedules, dependencies, milestones, workload, and task progress in one place.
What Google does offer is a spreadsheet-based workaround. You can build a simple Gantt-style chart in Google Sheets, or use the Sheets Timeline view for basic schedule visualization. That can be useful for lightweight planning. But once several people, deadlines, dependencies, files, and updates are involved, most teams need a dedicated project management tool that works inside their Google environment.
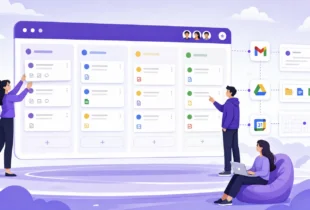
That is where Kanbanchi fits in. Kanbanchi adds a Gantt chart, Kanban board, time tracker, and task collaboration to Google Workspace, while keeping work connected to Google Drive, Gmail, and Google Calendar.
Google Workspace can support project planning, but it does so through separate apps. Each app handles part of the job. None of them provides a full Gantt chart experience on its own.
Google Sheets is the most common Google-based way to create a Gantt chart. Teams use columns for task names, owners, start dates, due dates, and statuses. Then they add conditional formatting, stacked bar charts, or the Timeline view to visualize the schedule.
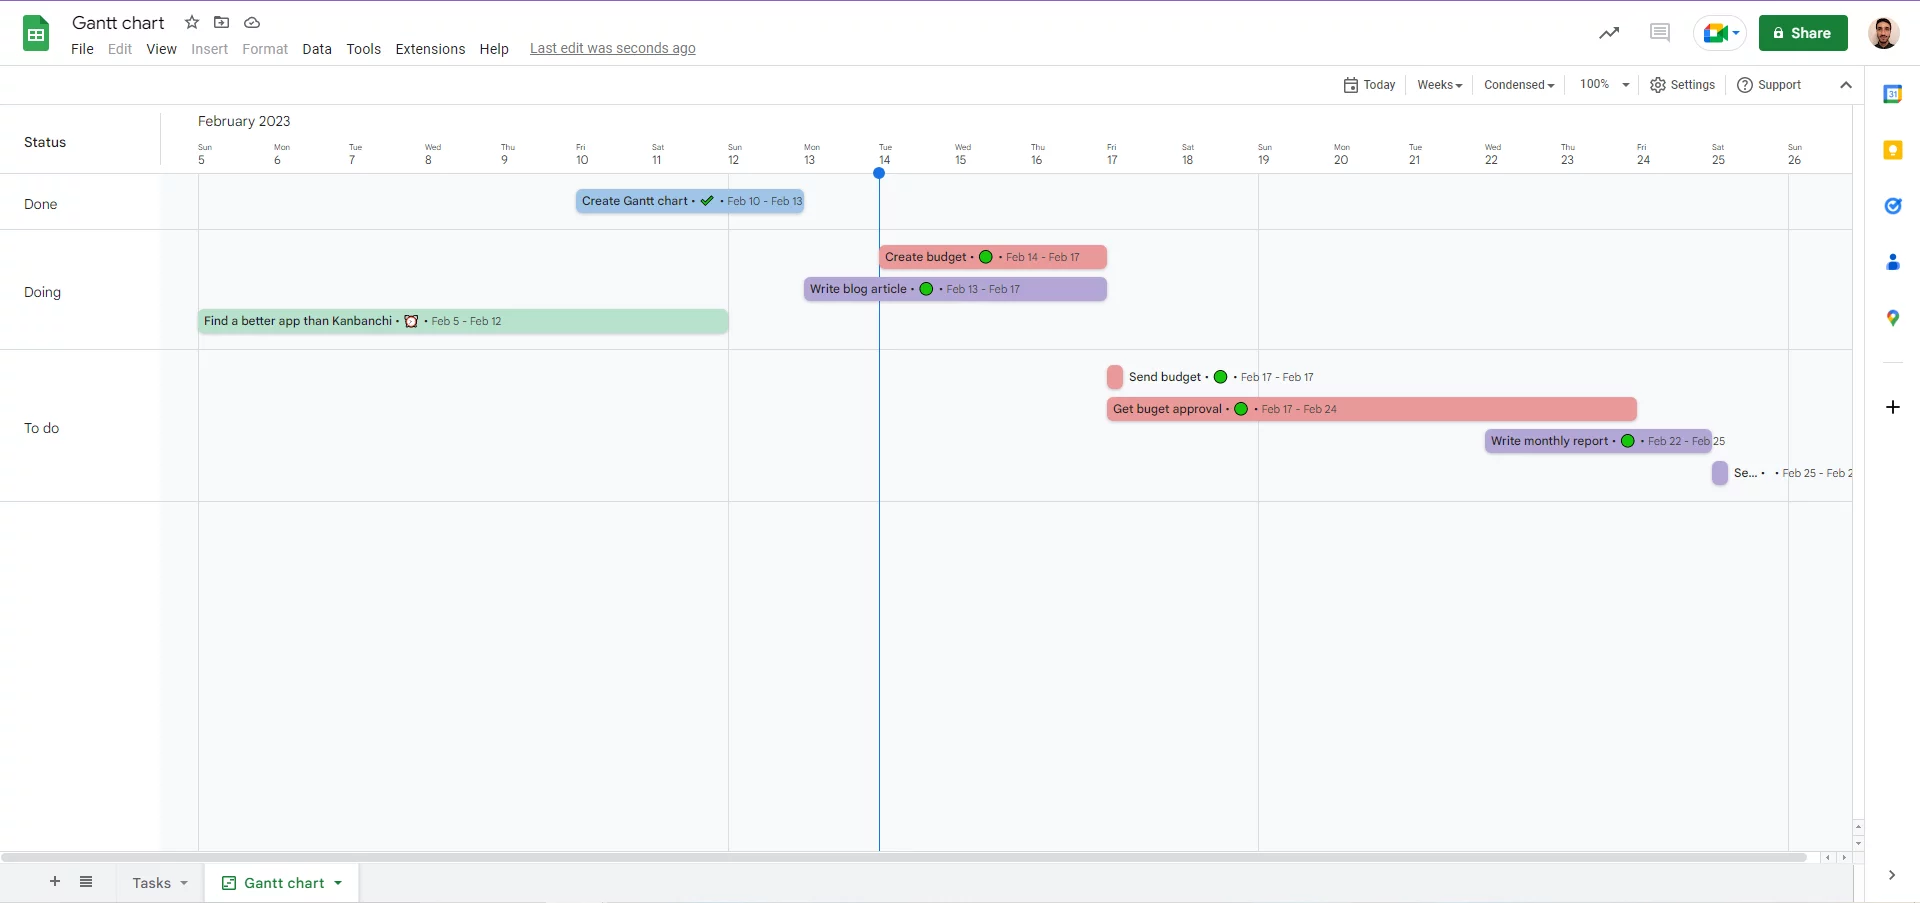
Google’s own Timeline view in Google Sheets can help turn structured spreadsheet data into a timeline. It is a useful feature for seeing tasks across time, especially when your data is already in a spreadsheet.
However, Sheets is still a spreadsheet. It does not behave like a project management system unless your team builds and maintains that structure manually.
Google Calendar helps teams see meetings, deadlines, and events. It is excellent for scheduling time, sending reminders, and coordinating availability.
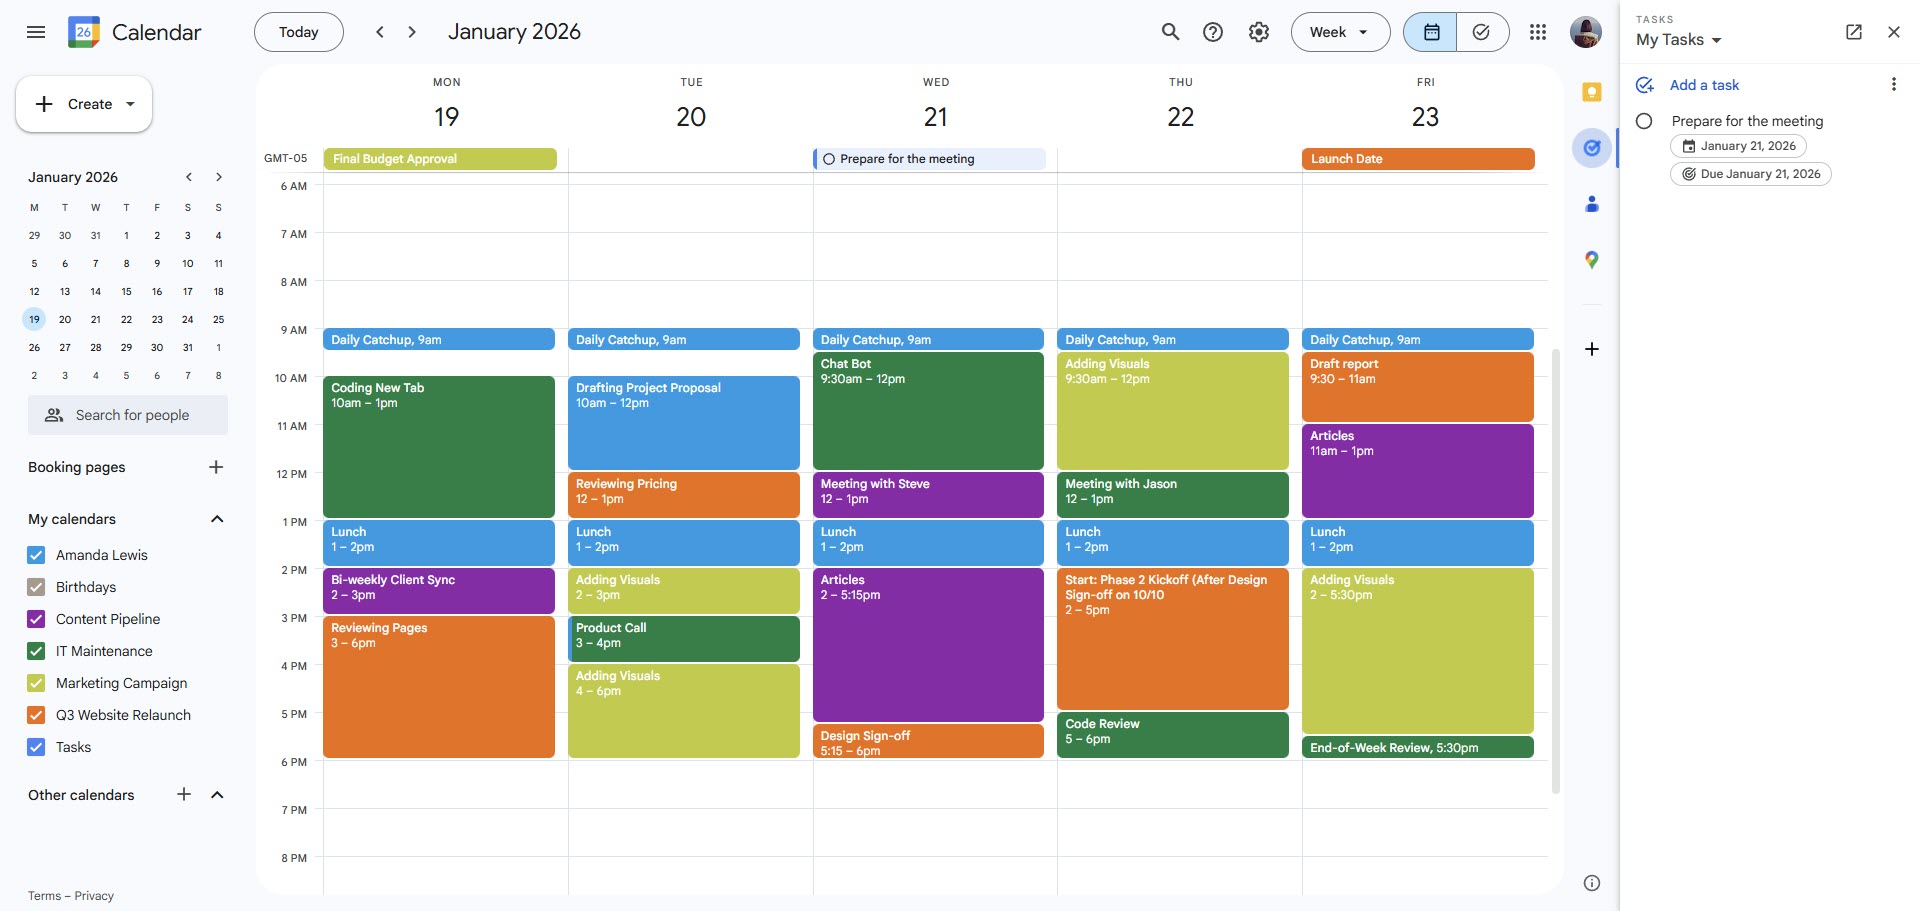
But Calendar is not a Gantt chart. It does not show a structured project plan with task dependencies, task progress, linked subtasks, or a project-wide critical timeline. It can support a project schedule, but it cannot replace one.
Google Tasks is useful for personal to-dos and simple reminders. It works well for individuals who want to keep track of small tasks connected to Gmail or Calendar.

For a team project, however, it is too limited. It does not provide a visual Gantt timeline, workflow stages, advanced prioritization, dependencies, time tracking, or project reporting.
Google Drive is often the home of project documents, briefs, contracts, designs, and reports. It is an essential part of the Google Workspace project workflow.
Still, Drive stores files. It does not show how tasks relate to one another over time. For that, you need either a spreadsheet workaround or a project management app integrated with Drive.

Google Workspace covers files, communication, and dates, but teams usually need an added project layer to manage timelines visually.
If your project is small, Google Sheets can be enough. A spreadsheet Gantt chart is especially useful for one-time plans, personal schedules, or simple project summaries that do not change often.
A basic setup usually looks like this:
For a detailed walkthrough, see How to create a Google Sheets Gantt chart. It explains how to build a Gantt-style view in Sheets and where this approach works best.
The important thing to remember is that a spreadsheet Gantt chart is only as accurate as your manual updates. If a task is delayed by just two days, you may need to adjust related tasks, formulas, colors, and stakeholder expectations yourself.
Sheets are flexible, but flexibility can become maintenance work. As soon as a project has multiple contributors, changing deadlines, dependencies, and files, a spreadsheet timeline often becomes a second job.
Here are the most common limitations business teams run into:
| Project need | Google Sheets workaround | Common issue for teams |
|---|---|---|
| Task ownership | Add owner names in cells | Updates depend on everyone editing the sheet correctly |
| Dependencies | Add notes or formulas | Related tasks do not automatically behave like linked project tasks |
| Progress tracking | Use percentages, colors, or checkboxes | Progress can become inconsistent across teams |
| Collaboration | Comments and shared editing | Task discussions can get mixed with spreadsheet comments |
| File management | Paste Drive links into cells | Files are not naturally part of the task workflow |
| Time tracking | Add manual time columns | No built-in project time tracker |
| Reporting | Build formulas or export data | Requires spreadsheet skills and ongoing maintenance |
For a manager, the biggest risk is not that Sheets cannot display a timeline. It can. The risk is that the timeline gradually stops reflecting reality.
Someone changes a date but forgets to update a dependency. A team member completes work but does not update the status. A file is linked in the wrong row. A stakeholder checks the sheet and sees an outdated plan. These small issues can quickly reduce trust in the schedule.
A useful Gantt chart is more than a horizontal bar chart. It should help a team understand the project plan, adjust it when things change, and coordinate work without constant status meetings.
For business teams, a proper Gantt chart should make it easier to:
It is also worth noting that Gantt charts and Kanban boards solve different problems: Gantt charts show the schedule, Kanban boards show the workflow. If you’re still deciding which one your project actually needs, Gantt vs Kanban: what to use for my project covers that choice in full.
Kanbanchi is designed for teams that already work in Google Workspace and need project management without moving work into a disconnected system. It brings visual planning and execution into one tool: Kanban boards for task flow, Gantt charts for timelines, and time tracking for visibility into effort.
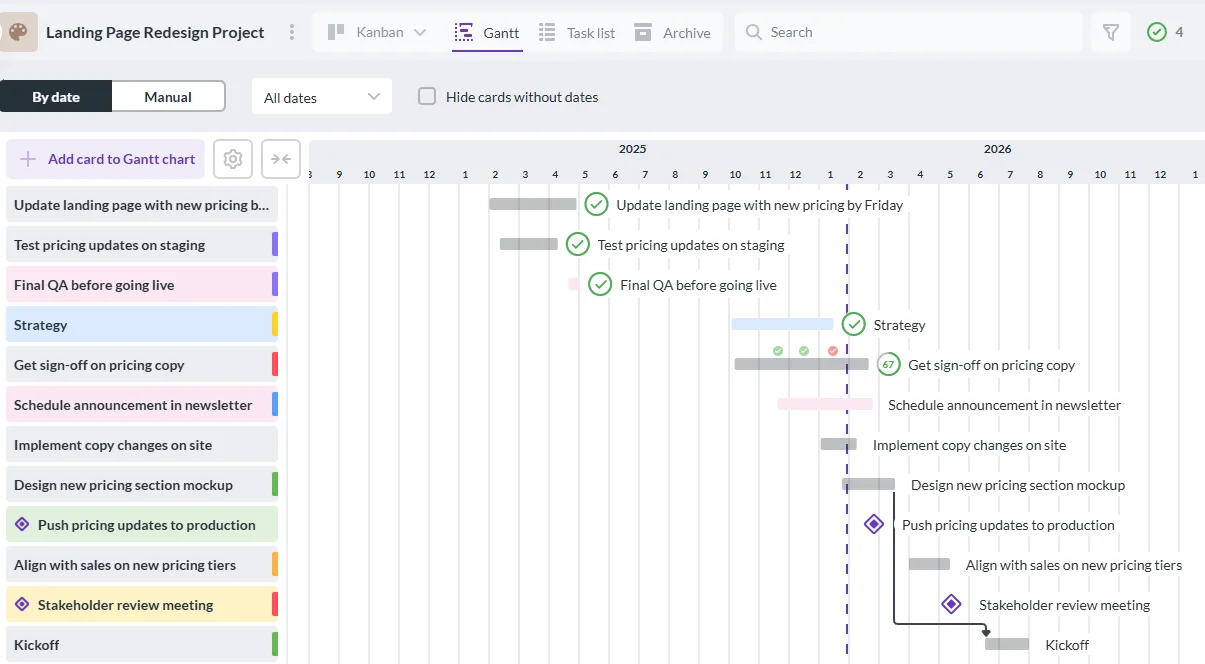
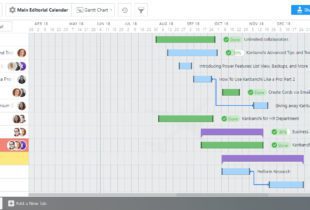
In Kanbanchi, a project board can be viewed as a Kanban board or as a Gantt chart. Cards represent tasks, and those same cards can appear on the timeline with start dates, due dates, progress, assignments, and other task details. This means the team does not need to maintain a separate spreadsheet just to keep the project schedule visible.
Kanbanchi also connects with familiar Google tools. Teams can attach files from Google Drive and Shared Drives, create cards from Gmail, sync dates with Google Calendar, and export board data to Google Sheets. For organizations using Google Workspace policies, Kanbanchi boards can be shared internally or externally according to company settings.
This makes Kanbanchi especially useful for team leads, operations managers, project managers, marketing teams, HR departments, IT teams, and business owners who need to know what work is happening, who owns it, and whether the project is still on schedule.
The right choice depends on the size and complexity of your project. A spreadsheet can be enough for a simple plan. A dedicated tool becomes more valuable when the project is active, collaborative, and time-sensitive.
| Capability | Google Sheets Gantt workaround | Kanbanchi Gantt chart |
|---|---|---|
| Basic timeline view | Yes, with manual setup or Timeline view | Yes, connected to project cards |
| Kanban board | No native board view | Built-in Kanban board |
| Task comments and collaboration | Possible through cell comments | Built into task cards |
| Google Drive attachments | Manual links in cells | Attach files from Google Drive and Shared Drives |
| Gmail task creation | Manual copy and paste | Create cards from Gmail |
| Google Calendar connection | Manual or separate setup | Add events to Google Calendar |
| Time tracking | Manual columns | Built-in time tracker |
| Dependencies and milestones | Limited or manual | Available in Gantt planning workflows |
| Reporting | Spreadsheet formulas or exports | Export data to Google Sheets and connect to reporting dashboards |
| Best for | Simple or occasional timelines | Team projects that need live planning and execution |
If your team is already asking who owns a task, what is blocked, what has moved, and whether the deadline is still realistic, you have likely outgrown a spreadsheet-only Gantt chart.
A Google Sheets Gantt chart can be a good option when your project is simple, and the timeline is mostly static. For example, a solo consultant might use Sheets to plan a short engagement. A department head might create a high-level timeline for a presentation. A small team might use it for a one-off event where there are only a few tasks and no complex dependencies.
Sheets are also helpful when you need full control over formatting. If your main goal is to create a visual timeline for reporting rather than to manage day-to-day work, a spreadsheet can do the job.
In short, use Google Sheets when the Gantt chart is mainly a document.
Kanbanchi is a better fit when the Gantt chart is part of the daily workflow. If team members need to update tasks, discuss work, attach files, adjust deadlines, track time, and collaborate in real time, a spreadsheet will usually create extra admin work.
Kanbanchi is especially relevant when:
This is part of a broader Google Workspace project management gap. Google Workspace is powerful for collaboration, but it is not a full project management suite on its own. For more context, check out the guide Finding the Best Google Workspace Project Management App for Your Team.
In Kanbanchi, the Gantt chart and the Kanban board are two views of the same cards. Planning the schedule and running the daily work don’t require two separate documents that someone has to keep in sync.
That’s the practical difference from a Sheets-based Gantt chart. In Sheets, the timeline is always a separate artifact. When a date changes on the board, nothing updates the spreadsheet except a person remembering to.
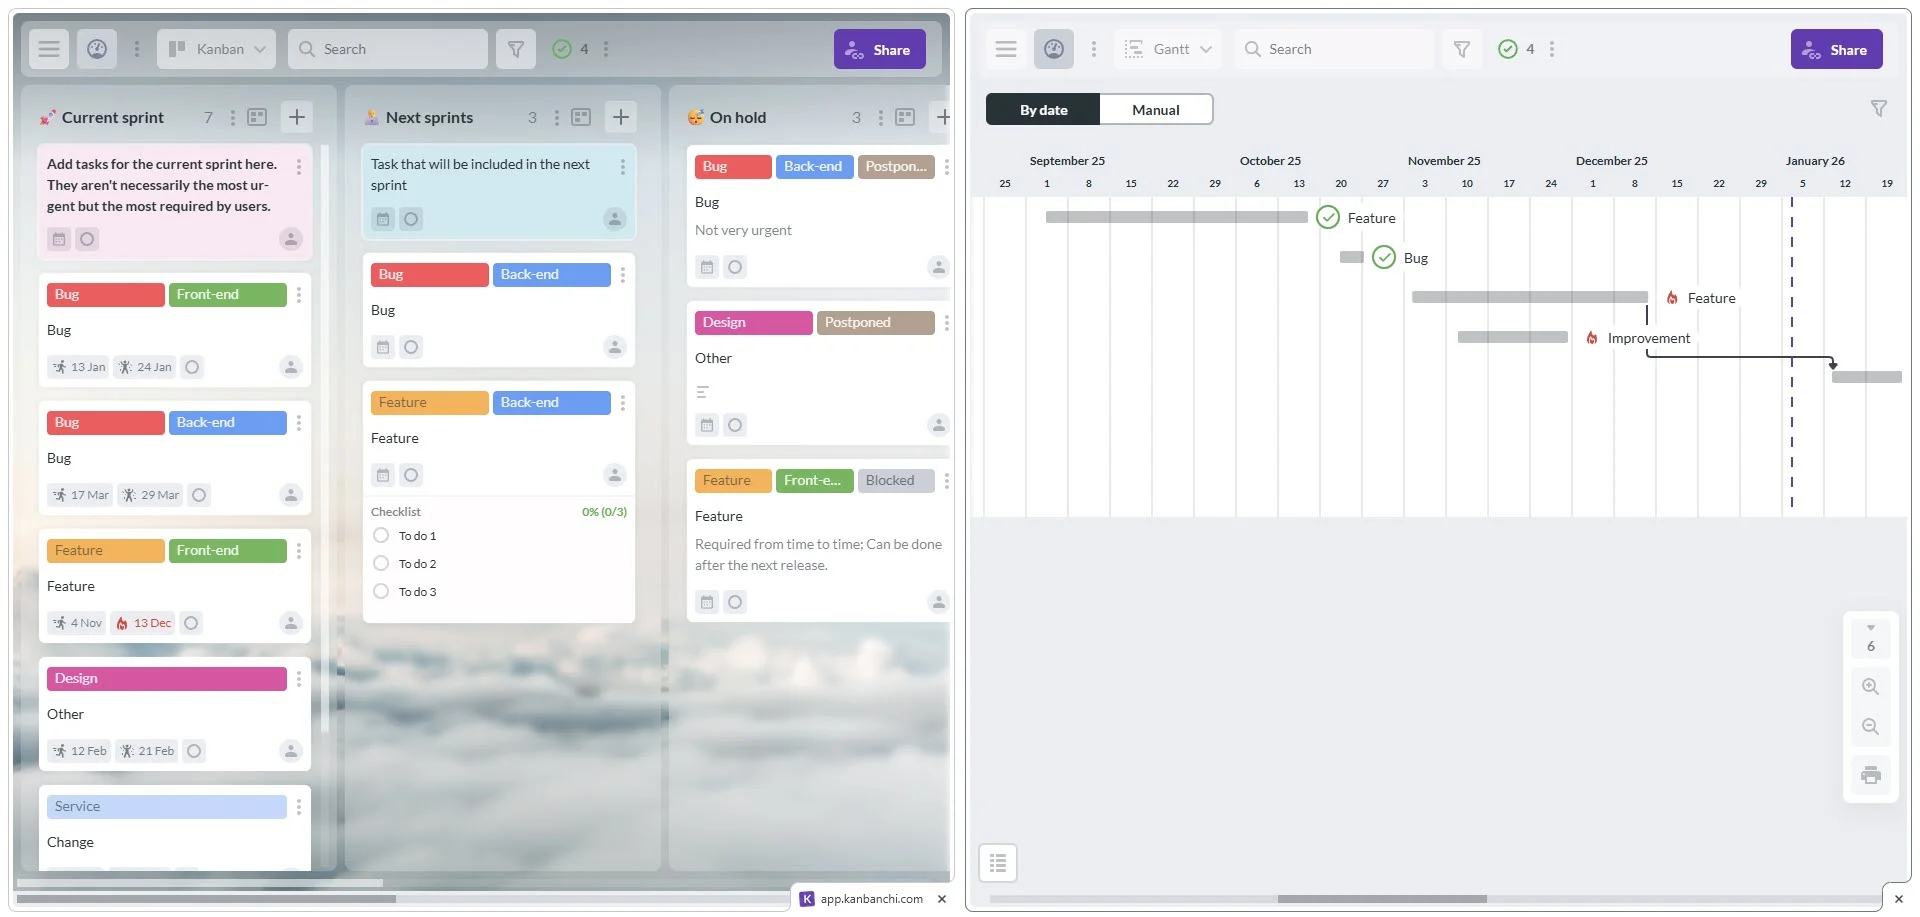
For how switching between the two views works day to day, see Why Hybrid Project Management Software is the Future.
Sign up for a free trial of Kanbanchi now
No. Google Workspace does not include a dedicated native Gantt chart tool for project management. Google Sheets can be used to create Gantt-style timelines, but this is a workaround rather than a full project planning feature.
Yes. You can create a Gantt chart in Google Sheets using a table of tasks, start dates, end dates, formatting, charts, or Timeline view. This works best for simple projects and high-level schedules.
It depends on the project. Sheets can work for small, simple plans. For team projects with owners, dependencies, files, comments, time tracking, and frequent changes, a dedicated project management tool is usually more reliable.
No. Google Calendar is useful for meetings, reminders, and due dates, but it does not show a complete project timeline with linked tasks, dependencies, progress, and workflow status.
For teams that want a Gantt chart connected to Google Workspace, Kanbanchi is a strong option. It combines Gantt planning with Kanban boards, time tracking, Google Drive attachments, Gmail task creation, Google Calendar integration, and Google Sheets export.
Yes, if your team needs more than a static timeline. Kanbanchi can replace spreadsheet-based Gantt planning by keeping tasks, dates, owners, files, comments, and progress connected in one collaborative workspace.
Google Workspace gives teams the foundation for collaboration, but it does not provide a full native Gantt chart. Google Sheets can help with simple timelines, but growing teams usually need a project management layer that keeps schedules, tasks, files, and updates connected.
Kanbanchi adds that layer directly to the way Google Workspace teams already work. If you want a Gantt chart that is connected to Kanban boards, Google Drive, Gmail, Calendar, time tracking, and reporting, try Kanbanchi and build a project workflow your team can actually keep up to date.
In this Article:
Start using Kanbanchi now
Start your free trial