In this Article:
Try Kanbanchi now
Start your free trial


When a team is small, alignment can happen almost by instinct. People sit near each other, ask quick questions, and remember who promised what. As soon as the team grows, adds departments, works remotely, or manages several projects at once, that informal system starts to break down.
The problem is rarely that people do not care. The problem is that work becomes invisible. Tasks live in emails, deadlines sit in calendars, files are buried in shared drives, and project updates are repeated in meetings that not everyone can attend. Visual project management tools solve this by turning work into a shared picture that everyone can understand quickly.
For business owners, team leads, project managers, and department heads, that shared picture is not just convenient. It is a practical way to reduce confusion, improve accountability, and keep execution moving without adding more meetings.
Most growing teams already use strong productivity systems. Google Workspace and Microsoft 365 are excellent for documents, email, meetings, calendars, and file storage. But they do not automatically show how every task, owner, file, deadline, and dependency connects inside a project.
Without a project layer, a team may have the project brief in Docs, the schedule in a spreadsheet, the deadline in Calendar, the decision trail in email, and the latest file in Drive or SharePoint. Each piece may be accurate on its own, but no one has the complete view.
That is where misalignment starts. One person thinks a task is waiting for approval. Another thinks it is ready for execution. A manager thinks the deadline is next Friday. The person doing the work knows a dependency slipped two days ago, but the update has not reached everyone yet.
Even when everyone has access to the same information, they may not interpret it the same way. A sales lead may prioritize a client request, a product lead may prioritize a release blocker, and an operations manager may focus on capacity.
Visual work systems make priorities explicit. If a card is marked urgent, assigned to a specific person, placed in the current sprint or active list, and connected to a due date, the team no longer has to guess what matters most.
Visual alignment is also human. People interpret the same update through different backgrounds, pressures, and assumptions. Reading lived-experience reflections, like Raw Life Thoughts, can be a useful reminder for leaders that alignment is not only a process issue but also about how people make sense of responsibility, risk, and change.
Traditional status reporting often happens after the problem has already affected the project. A weekly meeting may reveal that a task is blocked, but the blocker may have started three days earlier. By then, the schedule is already under pressure.
Visual project management tools reduce that delay. When a card stops moving, a due date turns red, or a dependency affects the timeline, the issue becomes visible before the next meeting.

A document can describe a project. A spreadsheet can list tasks. A calendar can show dates. But a visual project management system shows how work is flowing.
Kanban boards, Gantt charts, timeline views, task lists, swimlanes, labels, and progress indicators help teams see the state of work at a glance. That is the difference between reading a report and understanding the project.
A visual board answers questions such as:
The value is not only speed. It is a shared interpretation. When the whole team sees the same workflow, conversations become more focused, and decisions become easier.
A Kanban board is excellent for showing workflow. A Gantt chart is excellent for showing time, dependencies, and sequencing. Teams often need both.
For example, a marketing team may use a board to track campaign tasks through stages like Brief, Design, Review, Approved, and Published. The same team may use a Gantt chart to see whether landing page copy, ad creative, email setup, and launch approvals will be ready before the campaign date.
This is why many teams prefer tools that combine boards and timelines rather than forcing them to choose a single view.
If you want a deeper understanding, a Gantt chart vs. Kanban comparison explains when each view is most useful.
Alignment suffers when people have to search for the latest file, comment, checklist, or approval. A visual task card acts as a container for the work itself.
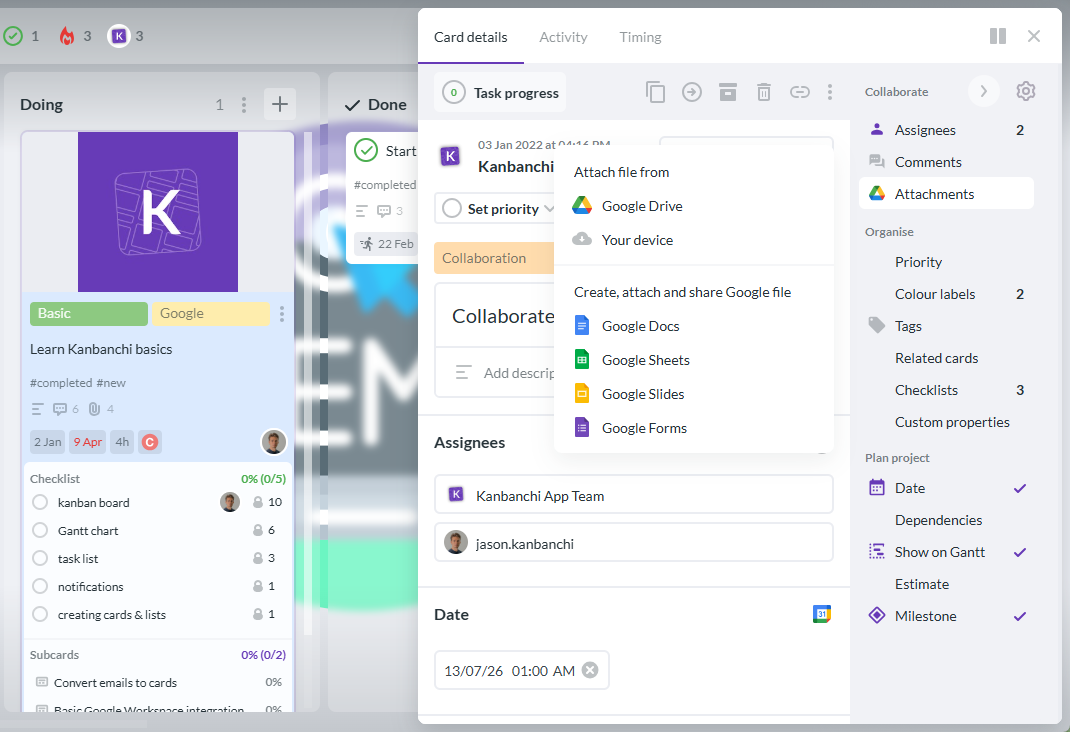
In a tool like Kanbanchi, teams can create task cards, assign people, add dates, use tags and color labels, attach files from Google Drive or Shared Drives, create checklists and subcards, and discuss task details in context. For Google Workspace teams, cards can also be created from Gmail, and dates can be synced with Google Calendar.
The practical result is simple: the team does not need to ask, “Where is the file?” or “Who has the latest update?” as often. The answer is on the card.
A shared board gives everyone a live view of the project. Team members do not need to wait for a manager to summarize progress, and managers do not need to chase every person individually.
This is especially important for hybrid and remote teams. When people work across locations or time zones, alignment cannot depend on everyone being online at the same moment. The board becomes the place where work speaks for itself.
For leaders, this creates a healthier operating rhythm. Instead of asking for constant updates, they can review the board, spot exceptions, and focus conversations where help is actually needed.
When priorities are hidden in private conversations, teams often multitask, switch context, and start too much work at once. Visual tools make prioritization public.
Priority labels, sorted cards, due dates, swimlanes, and filtered views help teams distinguish urgent work from nice-to-have work. This matters because alignment is not only about doing tasks correctly. It is about doing the right tasks in the right order.
A visible priority system also helps leaders explain trade-offs. If an urgent client request moves to the top of the board, everyone can see what may need to move down.
A bottleneck is often obvious on a visual board. Too many cards in Review may mean approvals are slowing down delivery. Too many cards assigned to one person may signal a workload issue. Too many tasks in Doing may show that the team has started more than it can finish.
This visual evidence changes the conversation. Instead of blaming individuals, the team can improve the workflow. Do we need clearer acceptance criteria? Should we limit work in progress? Is one department overloaded? Are approvals too centralized?
The board turns vague frustration into a concrete improvement discussion.
Many project delays come from dependencies that were not visible early enough. A designer waits for copy. A developer waits for requirements. A finance manager waits for vendor information. Each person may be doing their best, yet the project slows because the sequence is unclear.
A Gantt chart helps teams see those relationships in time. When a task moves, the impact on later tasks becomes easier to understand. This is especially useful for product launches, procurement, HR rollouts, client onboarding, operational changes, and cross-functional projects.
Visual timeline planning also helps leaders answer a critical question: “If this task slips, what else is affected?”
Good visual systems make ownership clear. Each card has an owner, due date, status, and relevant context. That clarity reduces the need for constant check-ins.
Accountability does not have to feel punitive. In fact, visual tools often make accountability easier because expectations are clear before work begins. People know what they own, where to find the information, and how their task connects to the bigger goal.
This is especially valuable for growing teams where managers cannot personally coordinate every detail. The system helps distribute responsibility.
A visual board can replace many status updates with focused decision-making. Instead of spending half a meeting asking what happened, the team can review the board and discuss exceptions.
For example, a weekly project review can focus on three questions: What is blocked? What is at risk? What decision do we need today?
That shift saves time and improves meeting quality. People arrive with the same visual context, so the conversation can move directly to problem-solving.
Read more articles about Project Management here
A visual project management tool should not create another disconnected place where work gets lost. It should fit the systems your team already relies on.
For Google Workspace teams, that means project work should connect naturally with Google Drive, Shared Drives, Gmail, Google Calendar, and Google Sheets. For Microsoft 365 teams, compatibility with OneDrive and SharePoint matters for keeping files and project execution close together.
This is where Kanbanchi is designed to be practical. It provides visual boards, Gantt charts, time tracking, task organization, and collaboration while integrating with Google Workspace and supporting Microsoft 365 environments. Teams can keep documents in their existing storage system while managing execution visually.
If your organization is already using Google Workspace and wants a dedicated project layer, this guide to Google Workspace project management apps can help you evaluate the options.
Kanbanchi helps teams align around the same work from different perspectives. A project manager may prefer the Gantt chart to manage timelines. A team member may prefer the Kanban board to move tasks through stages. A department head may use list views, filters, or exports to understand workload and progress.
Because these views are based on the same underlying project data, the team does not have to maintain separate systems for planning and execution. That reduces duplicate work and lowers the risk of outdated information.
For teams that manage several initiatives at once, features like swimlanes, tags, card templates, subcards, and Google Drive attachments can make complex work easier to structure without turning the system into a heavy administrative burden.
The most successful implementations begin by mapping how work actually moves. Before configuring a tool, define the stages your team uses every day.
A simple workflow might be To Do, In Progress, Review, and Done. A more specialized workflow might include Intake, Assigned, Drafting, Legal Review, Client Approval, Scheduled, and Complete.
The right workflow should be easy for the team to understand. If the board is too complex on day one, adoption will suffer.
A visual board only stays useful if the task information is consistent. Decide what every card needs before work begins.
For many teams, the essentials are owner, due date, description, priority, relevant files, checklist, and status. Teams that manage more complex work may also need dependencies, estimates, time tracking, or subcards.
Consistency is what turns a board from a colorful task list into a management system.
A board does not replace leadership. It gives leaders and teams a better place to lead from.
Use a regular review cadence to keep the board accurate. Daily standups, weekly project reviews, sprint planning, and monthly portfolio reviews can all work, depending on the team. The key is to review the same visual system repeatedly so that it becomes the natural place for alignment.
Do not try to model every business process at once. Start with one team, one department, or one high-value project. Learn what works, adjust the workflow, and then expand.
A practical rollout might look like this:
This approach helps the team experience the value before the tool becomes a company-wide requirement.
Not every team needs the same level of complexity. A small operations team may need a simple board-and-calendar sync. A larger enterprise team may need advanced permissions, reporting, templates, shared storage integration, and security compliance.
The table below connects common alignment problems with the features that help solve them.
| Alignment problem | Useful visual feature | Why it helps |
|---|---|---|
| Tasks are unclear | Cards with owners, descriptions, and checklists | Everyone knows what needs to be done and who owns it |
| Priorities keep changing | Priority labels, tags, filters, and sorting | The team can see what matters now |
| Deadlines slip | Gantt chart, start dates, due dates, and dependencies | Timeline risks become visible earlier |
| Work is overloaded | Swimlanes, workload views, and time tracking | Managers can spot capacity issues and rebalance work |
| Files are hard to find | Drive, Shared Drive, OneDrive, or SharePoint attachments | Project context stays connected to the task |
| Meetings are too long | Live boards and filtered views | Updates are visible before the meeting starts |
| Reporting is manual | Export to Google Sheets or reporting integrations | Leaders can analyze progress without rebuilding data |
A powerful tool that nobody uses will not keep a team aligned. Ease of adoption matters, especially when the team includes people from different departments with different levels of project management experience.
Look for a tool that is visual enough for non-project managers, structured enough for project leads, and integrated enough for IT and operations leaders. The best system reduces friction instead of adding another place to update work.
Kanbanchi’s focus on visual boards, timeline planning, and familiar Google Workspace or Microsoft 365 connections makes it a strong fit for teams that want structure without forcing everyone into a complicated project management environment.
If every idea, task, request, and reminder goes onto the same board without structure, the board becomes noise. Use lists, swimlanes, tags, and templates intentionally. Separate active work from backlog items where needed.
Visual project management should make work clearer, not create administration for its own sake. If people spend more time updating fields than completing tasks, simplify the process.
A board needs rules. Define when cards move, what Done means, who updates due dates, and how blockers are flagged. These agreements are what make the visual system reliable.
A strategy document or project plan is not enough if daily execution happens elsewhere. The strongest alignment comes when planning, tasks, timelines, files, and updates stay connected in one system.
Visual project management tools help teams plan, organize, and track work through visual formats such as Kanban boards, Gantt charts, timelines, lists, and workload views. They make tasks, owners, deadlines, priorities, and progress easier to understand at a glance.
They create a shared source of truth. Instead of relying on scattered emails, spreadsheets, and meetings, the team can see what is planned, what is in progress, who owns each task, what is blocked, and which deadlines are at risk.
Agile teams often use visual boards, but the same approach works for marketing, HR, operations, sales, procurement, education, nonprofits, and executive projects. Any team that needs shared visibility can benefit.
Use a Kanban board to manage workflow stages and day-to-day execution. Use a Gantt chart to manage timelines, dependencies, and scheduling. Many teams benefit from using both views together.
Integration keeps project work close to the files, emails, calendars, and storage systems your team already uses. This reduces duplicate work, improves adoption, and helps teams maintain a clearer project record.
Kanbanchi combines Kanban boards, Gantt charts, time tracking, task lists, templates, swimlanes, file attachments, Gmail task creation, Calendar sync, and Google Workspace integration in one visual project management tool. It also supports Microsoft 365 environments, helping teams manage work in the ecosystem they already use.
Start free trial of Kanbanchi today
Team alignment does not come from more status meetings. It comes from shared visibility, clear ownership, realistic timelines, and a workflow that everyone trusts.
If your team already works in Google Workspace or Microsoft 365 and needs a clearer way to manage projects, Kanbanchi can help you bring tasks, timelines, files, priorities, and progress into one visual system.
Explore Kanbanchi and see how a visual project management tool can help your team stay aligned from planning to delivery.


In this Article:
Start using Kanbanchi now
Start your free trial