How can I create a burn up chart in Kanbanchi?
You may create a burn up chart in Kanbanchi. It will help you to compare the number of completed tasks with the overall work scope. The number of completed tasks is on the vertical axis, with time along the horizontal.
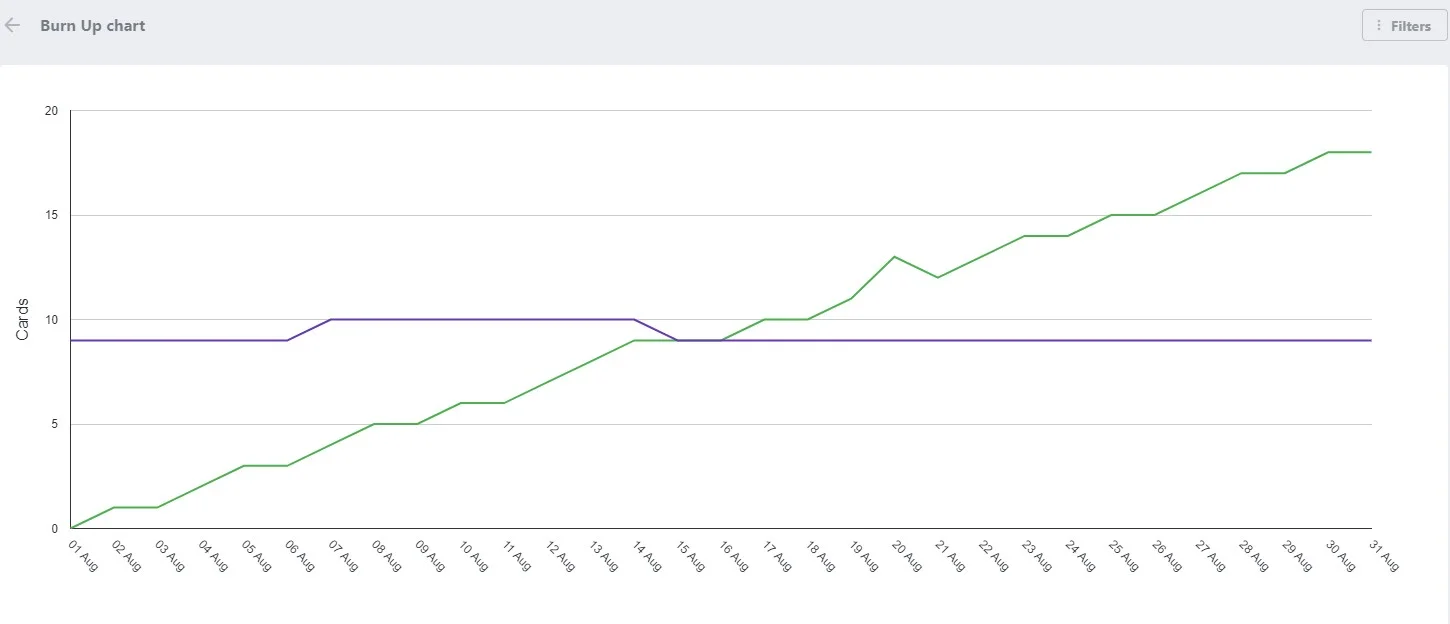
Each coordinate corresponds with the number of completed tasks at each stage of the process for the corresponding day. Each graph describes the behaviour of the cards in a particular list, namely, it shows the number of cards in the list for a period of time.
To create the burn up chart, open the board you need and switch to Reports by clicking the drop-down list on the top panel near the board name.
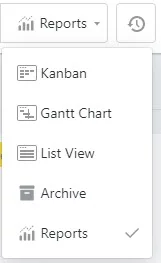
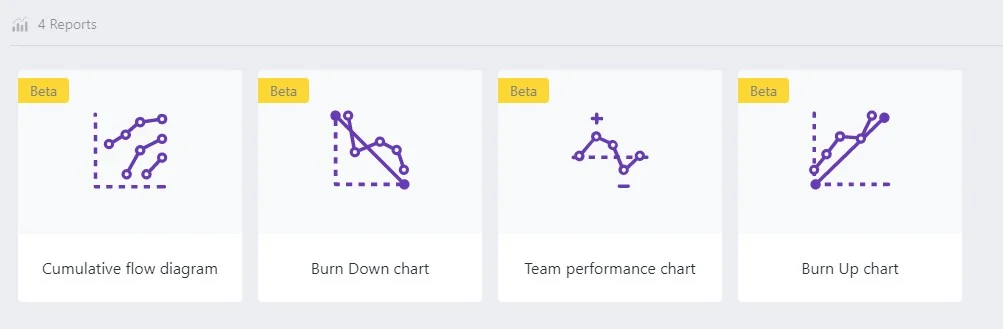
Choose Reports and click burn up chart.
You may choose what lists to display on the chart and a period of time. Also, you may choose to show the ideal work remaining line and how to define done cards.
You may choose how done cards should be recognised and what list should be considered as done.
Hover the cursor alongside the chart lines to see the information about the particular date.
Reports are available with the Professional plan subscription.