How to create a project management dashboard? Integrating Kanbanchi with Power BI and Google Looker for advanced reporting
While Kanban boards excel at day-to-day project management, today’s executives demand dashboards that transform project data into strategic business intelligence. With 78% of organizations now requiring advanced project reporting capabilities beyond basic task tracking, the ability to integrate Kanbanchi data with enterprise-grade visualization platforms, such as Power BI and Looker, has become essential for achieving a competitive advantage. This comprehensive guide provides step-by-step instructions for creating a professional project management dashboard that turns your Kanbanchi exports into powerful executive reporting tools.
Why Advanced Project Management Dashboards Matter for Business Success
Bare Kanban boards, while effective for task visualization, fall short when executives require comprehensive business intelligence for strategic decision-making. Traditional project tracking methods often lack the necessary analytical depth for resource optimization, trend analysis, and predictive forecasting that modern organizations demand. The limitations become apparent when stakeholders need to assess portfolio performance, calculate project ROI, or identify operational bottlenecks across multiple initiatives.
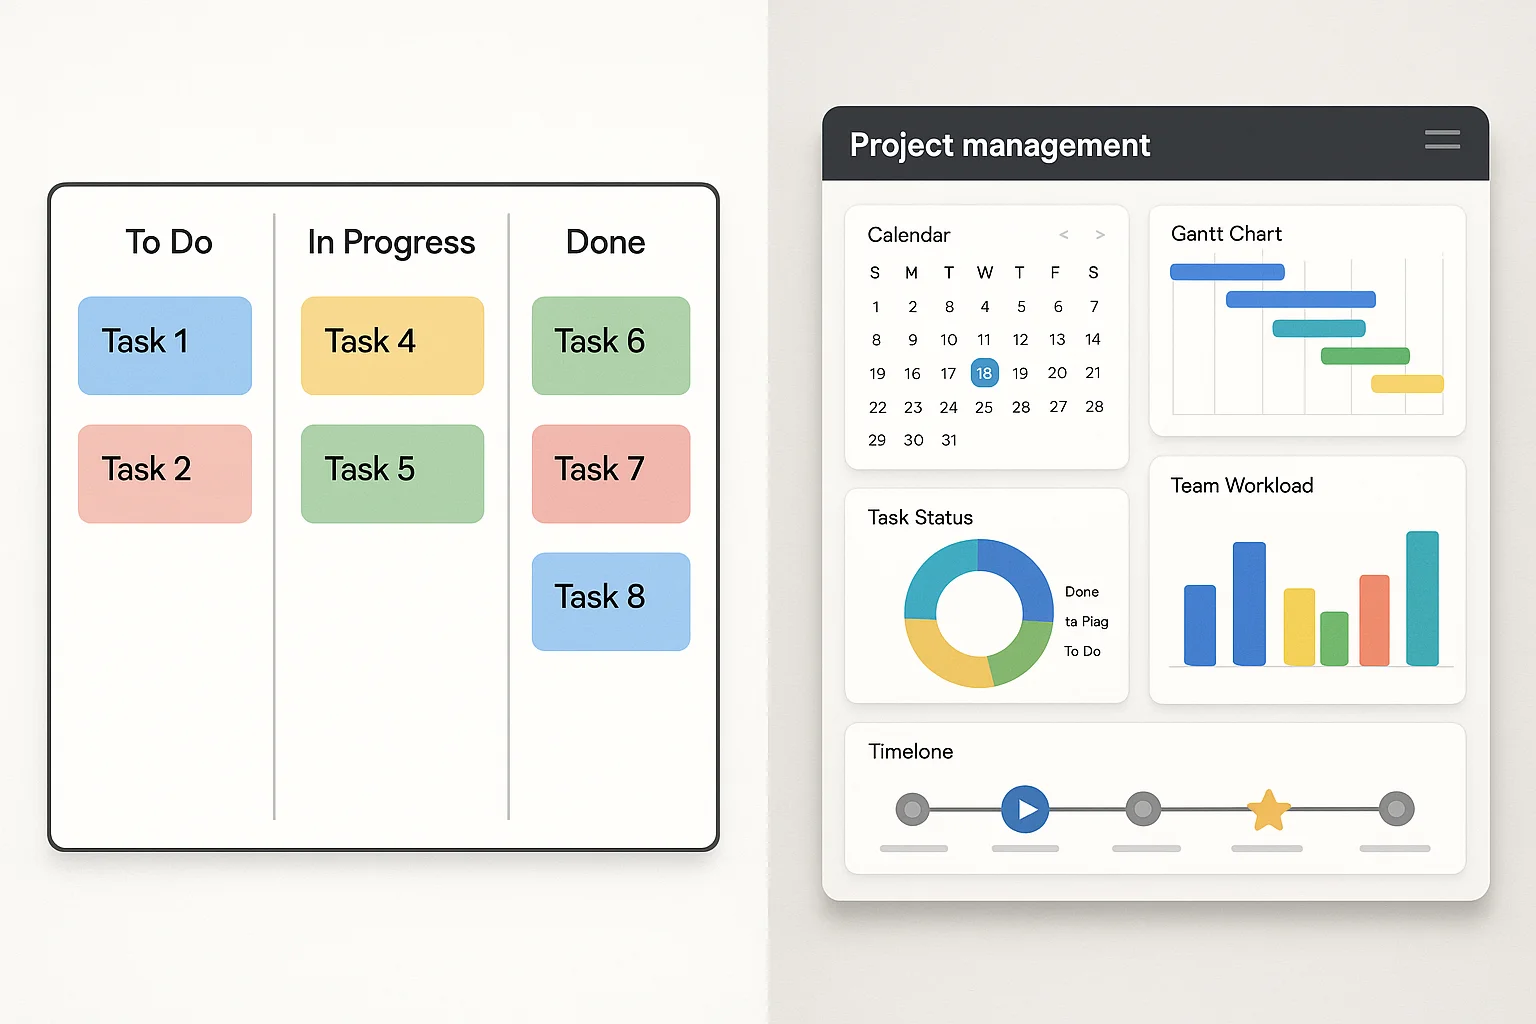
Advanced dashboards provide strategic insights beyond basic project tracking
Advanced project management dashboards bridge this gap by transforming raw project data into actionable insights. Organizations implementing sophisticated reporting solutions experience significant improvements in decision-making speed and quality. These dashboards enable real-time monitoring of critical metrics, automated alert systems for project deviations, and comprehensive analysis of team productivity patterns. The business value extends beyond simple reporting.
- Executive visibility into project performance enables proactive resource allocation, early risk identification, and strategic planning based on data-driven insights rather than intuition.
- Data-driven decision-making reduces project failure rates by up to 85%, according to industry surveys, while automated reporting capabilities free up valuable management time previously spent on manual report generation.
- Predictive analytics capabilities integrated into advanced dashboards enable project success forecasting, helping organizations avoid costly overruns and delays.
- Integration with business strategy ensures that project portfolios align with organizational objectives, maximizing return on investment and competitive positioning.
Understanding Kanbanchi Data Export Capabilities
Kanbanchi provides comprehensive data export functionality designed specifically for advanced reporting and business intelligence integration. As a native Google Workspace project management solution, Kanbanchi securely stores project data within your Google Drive infrastructure, offering multiple export formats for creating dashboards.
Kanbanchi’s Google Sheets integration enables direct export to familiar spreadsheet formats, while Microsoft Excel compatibility ensures cross-platform accessibility for organizations using mixed technology environments. Automated backup capabilities provide data security and recovery options for critical project information.
The platform supports CSV export formats that maintain data structure integrity for seamless integration with external reporting tools. Real-time data synchronization ensures that exported information reflects the current project state.
Available project metrics include detailed cycle time measurements, tracking task completion duration, throughput analysis measuring team productivity, and lead time calculations for end-to-end process evaluation. Team performance data encompasses individual and group productivity metrics, resource utilization rates, and collaboration effectiveness indicators.
Resource utilization tracking provides insights into capacity planning and workload distribution across team members. Custom field exports allow organizations to include project-specific metadata, while time tracker integration delivers precise labor cost analysis and billable hour tracking.
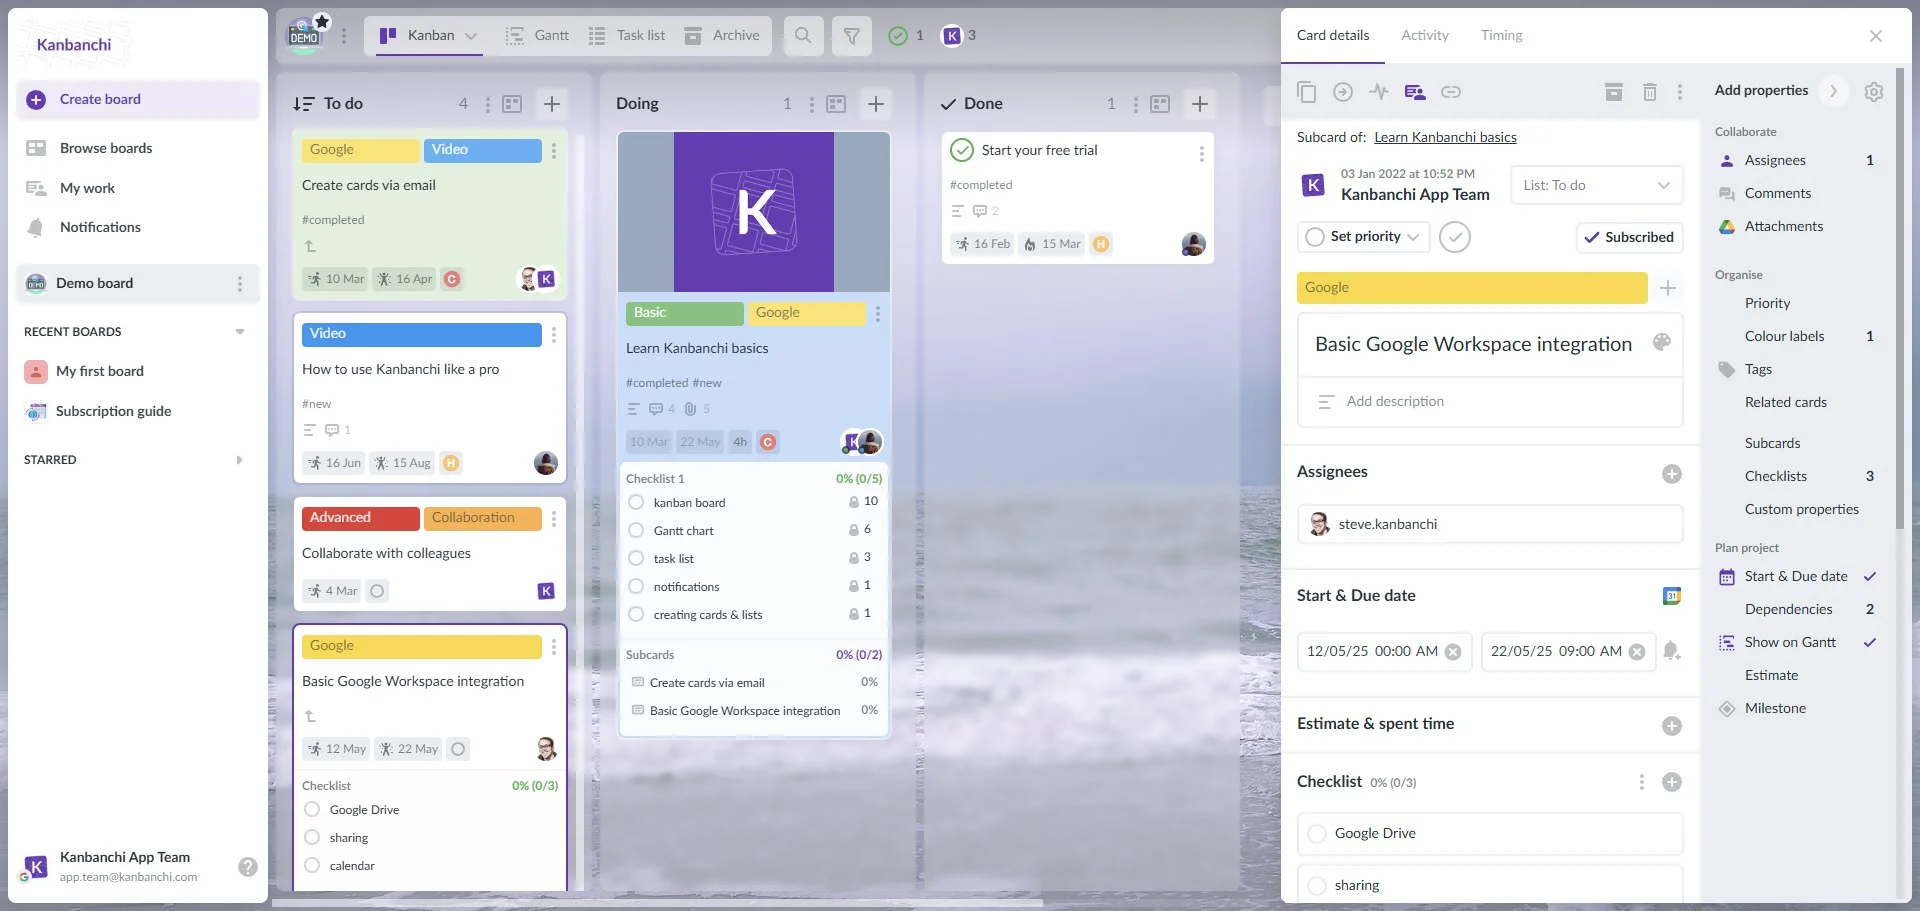
The export functionality includes card titles and descriptions for comprehensive task documentation, all active data for current project state analysis, and archived data inclusion for historical trend analysis. Time tracker data can be exported separately for detailed resource cost analysis and project profitability calculations.
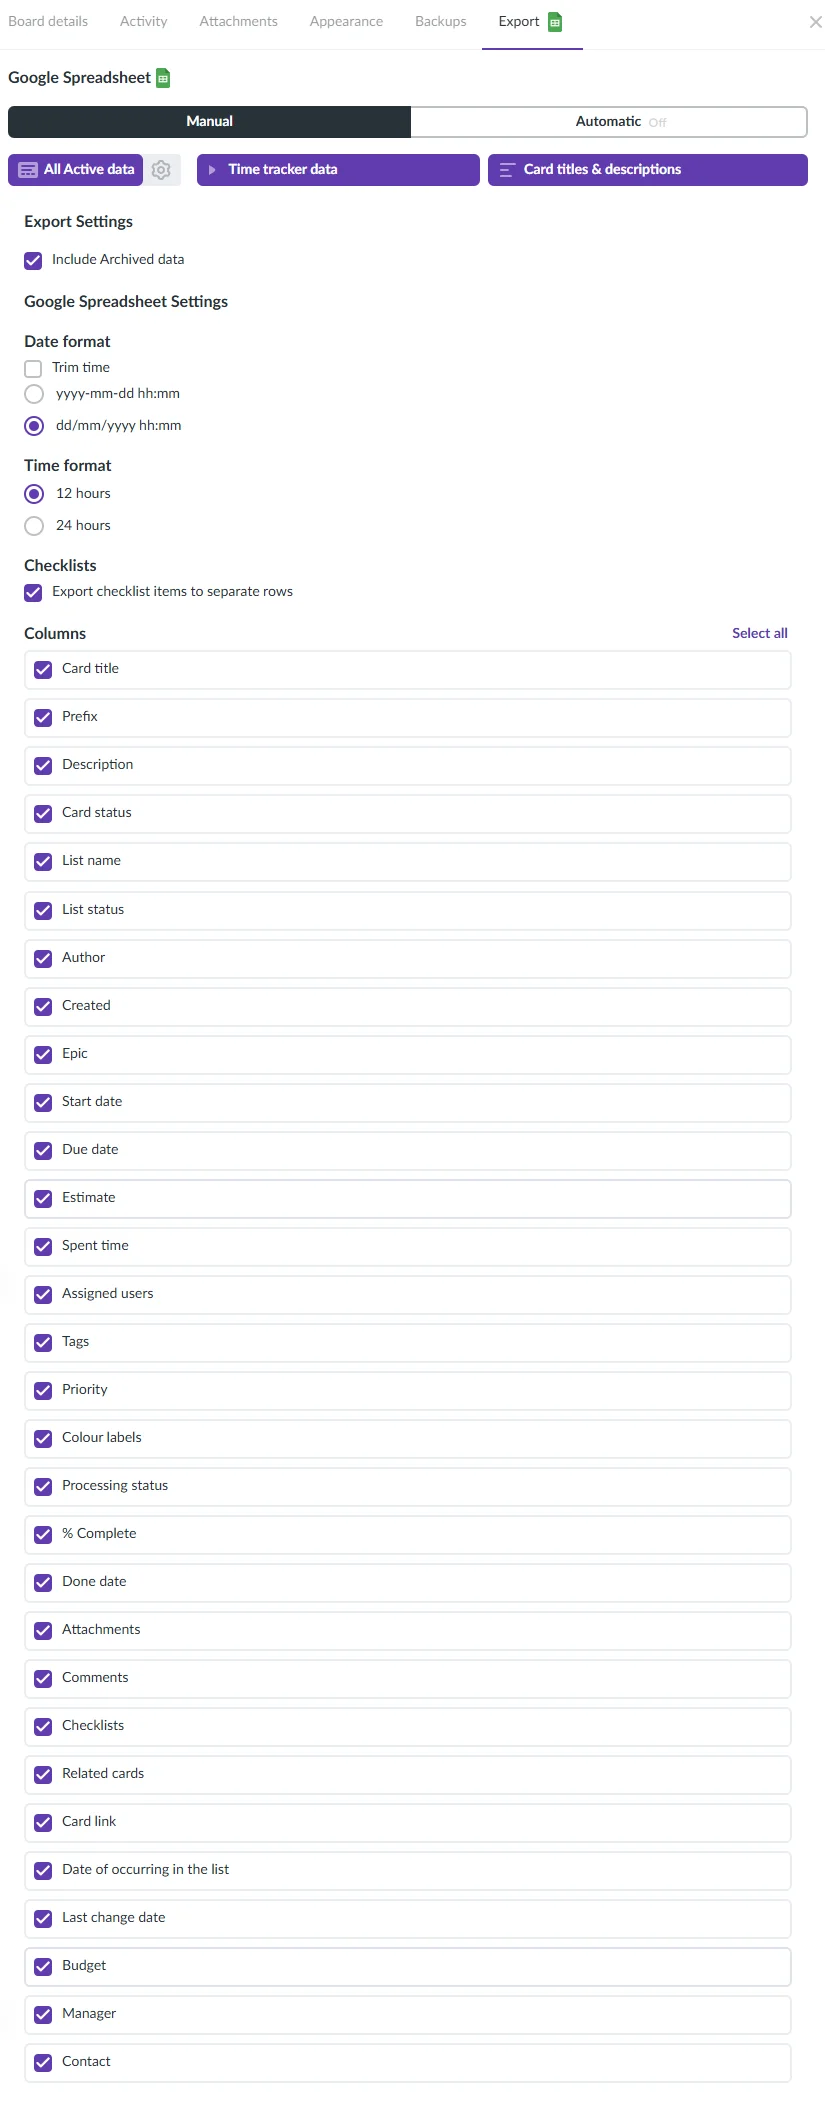
Kanbanchi’s comprehensive export capabilities provide rich data for advanced dashboard creation
Microsoft Power BI Integration: Complete Setup Guide
Power BI’s robust data import capabilities make it an ideal platform for transforming Kanbanchi project data into sophisticated business intelligence dashboards. The integration process leverages Power BI’s CSV import functionality combined with Kanbanchi’s comprehensive export options to create dynamic, interactive reporting solutions.
Step 1: Preparing Kanbanchi Data for Power BI Import
Begin by accessing your Kanbanchi board and navigating to the export functionality through the board settings menu. Select the appropriate export type based on your reporting requirements. All Active Data provides comprehensive current project information, while Time Tracker Data focuses on resource utilization metrics. Configure the export parameters by selecting relevant options for your dashboard needs.
Step 2: Connecting Data Sources and Establishing Relationships
Launch Power BI Desktop and select Get Data from the Home ribbon. Select “Text/CSV” as the data source type and navigate to your exported Kanbanchi file. Power BI’s Navigator window provides a preview of the data structure, allowing verification of import accuracy before proceeding. Utilize Power BI’s Query Editor for data transformation and cleansing. Configure column data types, remove unnecessary fields, and establish naming conventions that align with your reporting standards. Create calculated columns for derived metrics such as cycle time calculations and completion percentages.
Step 3: Creating Core Project Management Visualizations
Develop essential project management visualizations, including Gantt charts for timeline tracking, burn-down charts for progress monitoring, and resource utilization graphs for capacity planning and management. Power BI’s extensive visualization library supports complex project analytics, including cumulative flow diagrams for identifying bottlenecks and control charts for monitoring process consistency. Configure KPI tiles for critical metrics such as on-time delivery percentage, budget variance, and team velocity. Implement drill-down capabilities allowing users to navigate from high-level portfolio views to detailed task-level analysis.
Step 4: Building Interactive Dashboards and Reports
Design comprehensive dashboards that serve different stakeholder needs – executive summary views for senior management, operational dashboards for project managers, and detailed reports for team leads. Implement filtering capabilities enabling users to focus on specific projects, time periods, or team members. Create a responsive design ensuring dashboard functionality across desktop and mobile platforms. Configure conditional formatting to automatically highlight critical issues, overdue tasks, and performance exceptions.
Step 5: Setting Up Automated Data Refresh
Establish automated data refresh schedules to ensure dashboard currency is maintained. Configure on-premises gateways if required for secure data connections. Set up refresh failure notifications to ensure data integrity monitoring. Implement incremental refresh strategies for large datasets to optimize performance and minimize processing time. Configure data source credentials for seamless automated updates. Use Auto-export from Kanbanchi to get relevant files.
Step 6: Sharing and Collaboration Configuration
Configure Power BI workspace sharing permissions aligned with organizational security policies. Establish role-based access to ensure appropriate data visibility for different user groups. Set up subscription services for automated report distribution to stakeholders. Implement embedded analytics options for integration with existing organizational portals and systems.
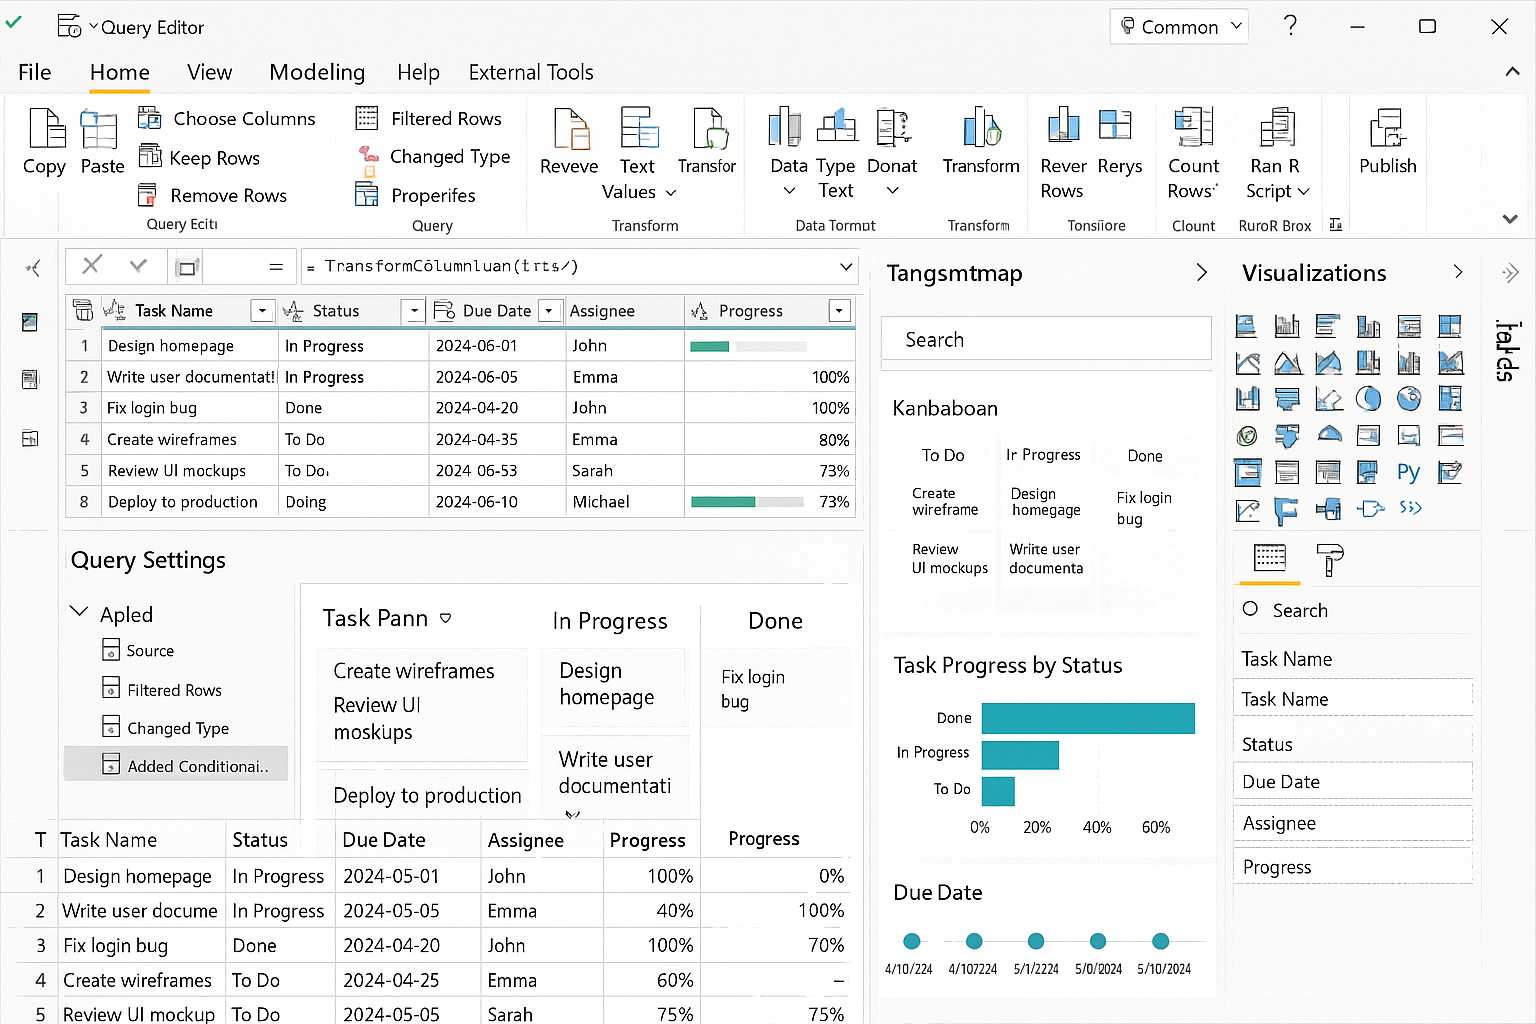
Power BI’s robust integration capabilities transform Kanbanchi exports into professional business intelligence dashboards
Google Looker Integration: Complete Setup Guide
Google Looker’s advanced data modeling capabilities provide sophisticated analytics options for Kanbanchi project data. The platform’s LookML modeling language enables the creation of complex data relationships and custom metrics tailored to project management requirements.
Step 1: Configuring Data Connection to Kanbanchi Exports
Establish secure connections to Kanbanchi exports using Looker’s file upload capabilities or automated connector services. Configure data source parameters, including file location, update frequency, and authentication requirements. Set up data transformation pipelines to handle Kanbanchi’s export format variations and ensure a consistent data structure for analysis and reporting. Implement error handling procedures for data quality assurance.
Step 2: Creating LookML Models for Project Data
Develop LookML models that accurately represent Kanbanchi’s data structure, including cards, lists, boards, and time tracking information. Define dimensions and measures relevant to project management analytics, such as completion rates, cycle times, and resource utilization. Create derived tables for complex calculations, including cumulative metrics, trend analysis, and comparative performance indicators. Establish data relationships between different Kanbanchi entities for comprehensive reporting capabilities.
Step 3: Building Explores and Dimensions
Configure Explore interfaces that enable business users to create custom analyses without technical expertise. Define dimension hierarchies for drill-down analysis from portfolio to individual task levels. Implement measure definitions for critical KPIs, including earned value calculations, schedule performance indices, and cost performance ratios. Create filter configurations for common analysis scenarios.
Step 4: Developing Interactive Dashboards
Design interactive dashboards that leverage Looker’s visualization capabilities, including custom charts, geospatial mapping for distributed teams, and real-time indicators for critical metrics. Configure dashboard filtering and cross-filtering for dynamic analysis and reporting. Implement a mobile-responsive design that ensures accessibility across various device types. Create dashboard themes aligned with organizational branding requirements.
Step 5: Implementing Automated Reporting
Set up scheduled reports for regular stakeholder distribution, including executive summaries, team performance reports, and project status updates. Configure alert systems to notify you of critical threshold breaches and milestone achievements. Establish data export capabilities to integrate with other organizational systems and support offline analysis requirements. Use Auto-export from Kanbanchi to get relevant files.
Step 6: User Access and Sharing Configuration
Configure user permissions and content access controls based on organizational hierarchy and data sensitivity requirements. Establish content validation procedures for report accuracy and consistency. Implement version control for dashboard modifications and change management procedures for reporting updates.
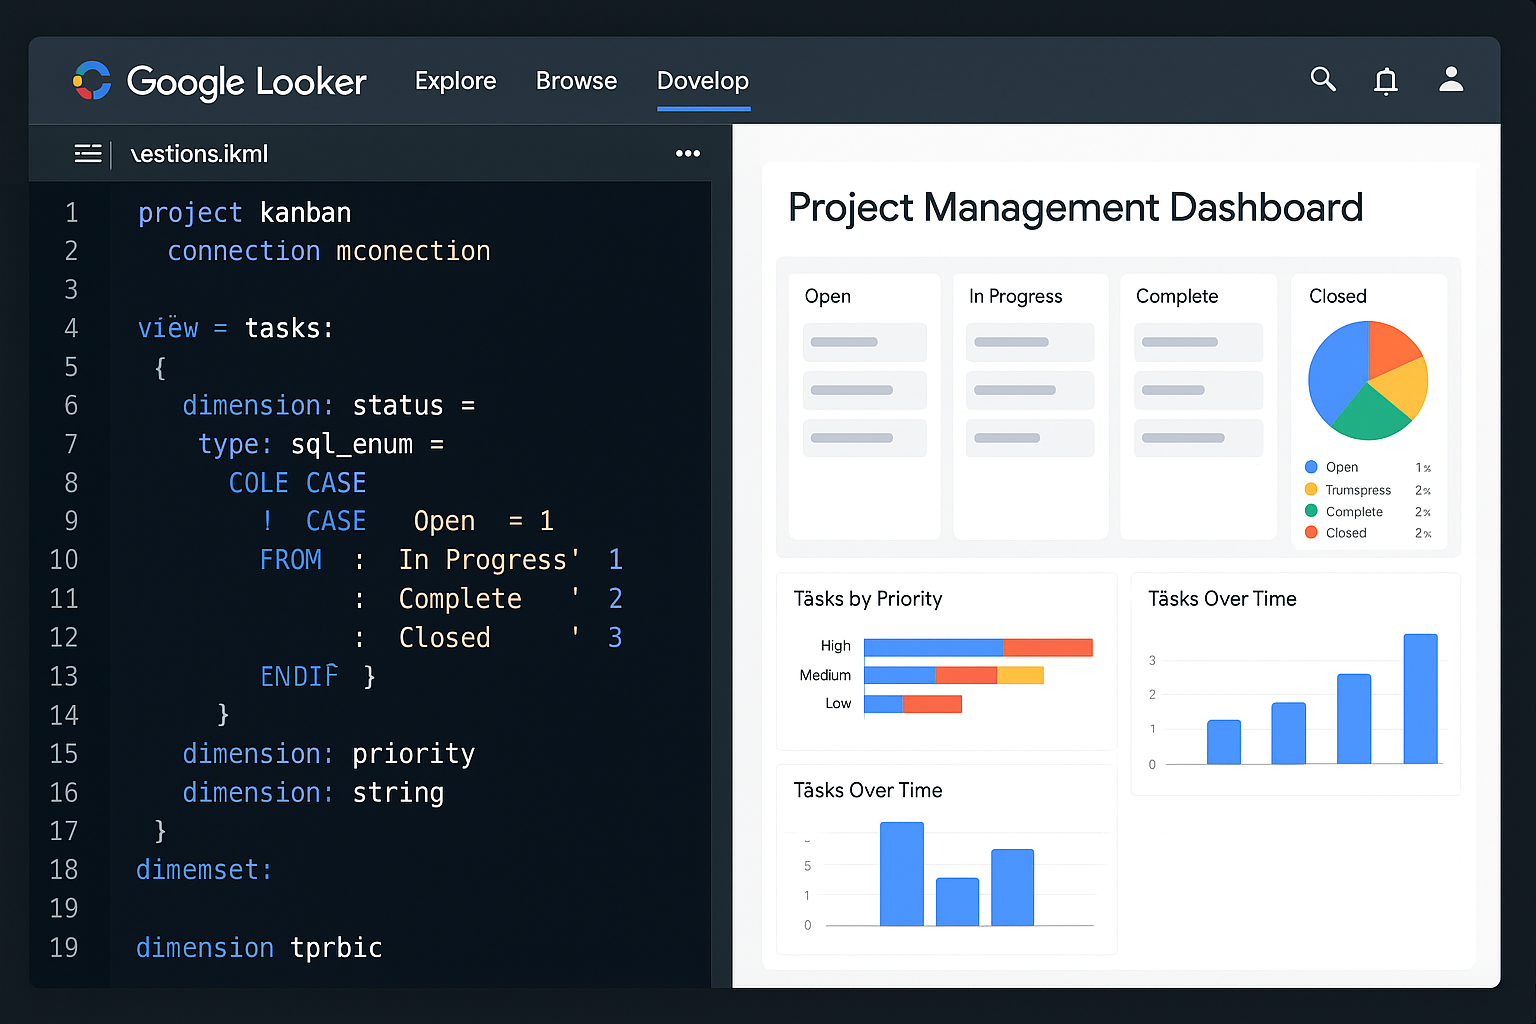
Looker’s advanced modeling capabilities enable sophisticated analysis of Kanbanchi project data
Essential Dashboard Views for Project Management
Proven dashboard views accelerate implementation timelines and ensure comprehensive visibility of projects across organizational levels. These views provide foundation structures that can be customized for specific industry requirements and organizational preferences while maintaining best practices for project management reporting.
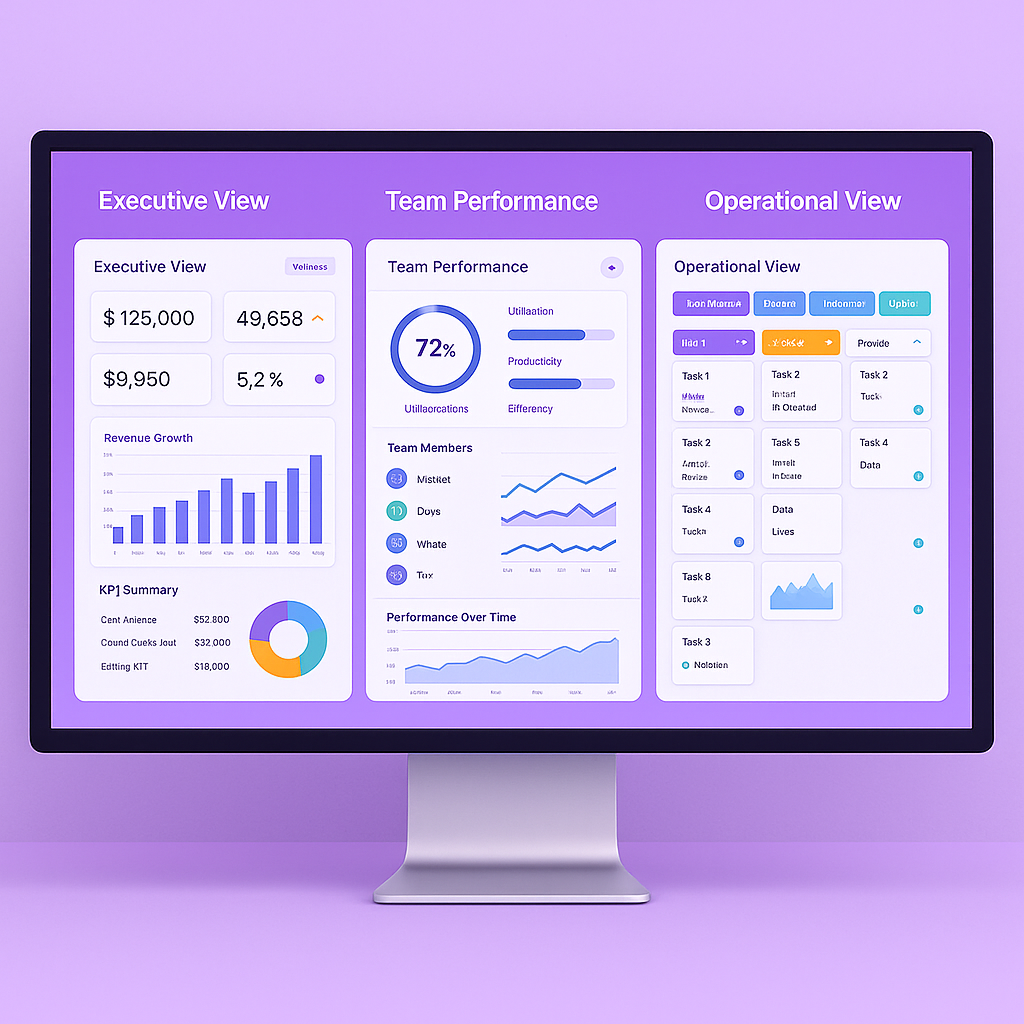
Executive Summary Dashboards focus on high-level KPIs, including portfolio health, resource utilization efficiency, and alignment with strategic objectives. These dashboards feature budget variance tracking, milestone achievement rates, and risk exposure summaries, which are essential for informed executive decision-making. Trend analysis capabilities enable the identification of performance patterns and predictive insights for strategic planning.
Team Performance Dashboards emphasize productivity metrics, individual contributor tracking, and collaboration effectiveness. Key components include velocity measurements, capacity utilization rates, and task completion patterns. Comparative analysis features enable benchmarking across different teams and projects for performance optimization.
Project Portfolio Dashboards provide comprehensive multi-project oversight capabilities, including cross-project resource allocation, interdependency mapping, and portfolio-level financial tracking. Advanced filtering enables stakeholders to analyze performance across different project types, business units, and time periods.
Operational Dashboards deliver detailed workflow analysis, including bottleneck identification, process efficiency metrics, and quality assurance tracking. Real-time updates provide immediate visibility into operational issues that require intervention. Drill-down capabilities enable investigation from high-level metrics to individual task details.
Predictive Analytics Dashboards incorporate forecasting models for project completion estimates, resource demand planning, and budget projection analysis. Machine learning integration enables trend extrapolation and risk assessment capabilities, facilitating proactive project management.
View customization options include industry-specific metrics, organizational KPI alignment, and branding consistency. Configuration wizards guide users through setup processes while maintaining data integrity and reporting accuracy.
Proven dashboard views accelerate implementation and ensure comprehensive project visibility
Key Metrics and KPIs for Project Management Dashboards
Effective project management dashboards rely on carefully selected metrics that provide actionable insights into project performance and organizational effectiveness. These KPIs must align with business objectives while offering practical guidance for operational improvements.
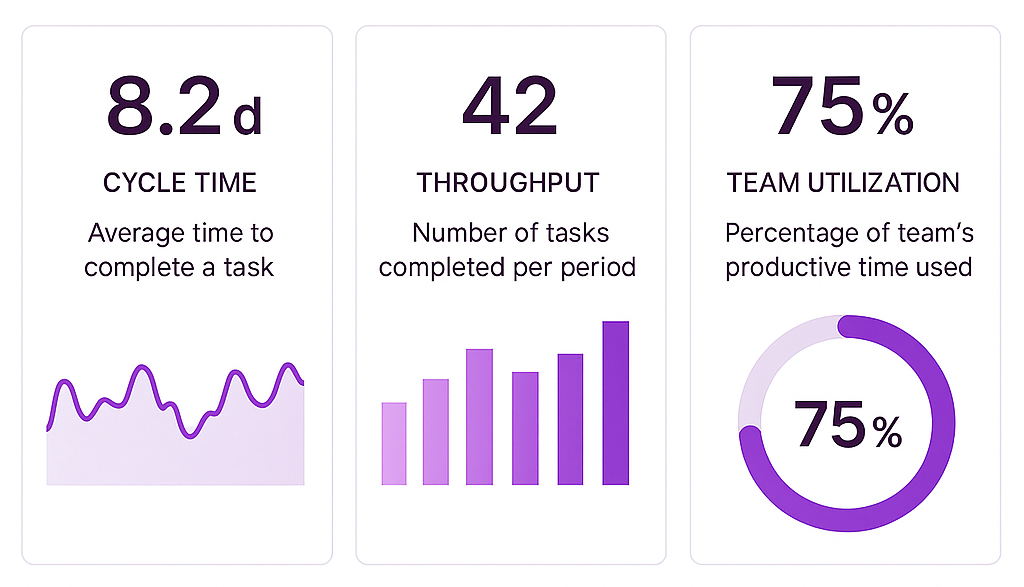
Cycle Time Analysis measures the duration required to complete individual tasks from initiation to delivery. This metric reveals process efficiency levels and identifies opportunities for workflow optimization. Calculation involves dividing total completion time by the number of processed items, providing average task duration benchmarks for capacity planning.
Throughput Measurements quantify the volume of work completed within specific timeframes. This metric enables capacity assessment and resource planning decisions. Combined with cycle time data, throughput analysis reveals system performance characteristics and scaling potential.
Work in Progress Optimization tracks the number of concurrent tasks and identifies bottleneck locations within project workflows. Excessive WIP indicates resource constraints or process inefficiencies requiring management attention. Optimal WIP levels strike a balance between productivity and quality maintenance.
Team Utilization and Capacity Planning metrics assess resource allocation efficiency and identify workload imbalances. These measurements support hiring decisions, skill development planning, and the optimization of project assignments. Utilization rates between 70% and 85% typically indicate healthy productivity without a risk of burnout.
Project Success Rate and On-time Delivery statistics provide fundamental performance indicators for project management effectiveness. These metrics support client relationship management, reputation building, and process improvement initiatives. Historical tracking enables the identification of trends and predictive modeling.
Budget Performance Tracking compares planned versus actual costs across different project phases and categories. Variance analysis helps identify the effectiveness of cost control and the accuracy of estimation. Earned value management integration offers comprehensive capabilities for assessing financial performance.
Quality and Customer Satisfaction Metrics measure the effectiveness of deliverables and stakeholder approval rates. These indicators support continuous improvement efforts and client retention strategies. Defect rates, rework percentages, and customer feedback scores provide a comprehensive quality assessment.
Focus on proven KPIs that drive project success and organizational performance
Troubleshooting Common Integration Challenges
Successful dashboard integration requires proactive management of technical challenges and implementation obstacles. Common issues range from data connectivity problems to performance optimization requirements that can impact the effectiveness of project reporting.
Data Connection and Authentication Issues frequently occur during initial setup phases, particularly when integrating cloud-based services with enterprise security protocols. Network configuration problems, firewall restrictions, and authentication token expiration can disrupt automated data refresh processes. Resolution requires coordination with IT security teams to establish secure connection protocols while maintaining data access requirements.
Export Formatting and Data Structure Problems emerge when Kanbanchi exports don’t align with dashboard platform expectations. Character encoding conflicts, date format inconsistencies, and column naming variations can cause import failures. Implementing data transformation pipelines and standardization procedures ensures a consistent data structure across different export scenarios.
Performance Issues with Large Datasets become apparent when organizations scale dashboard usage across multiple projects and extended time periods. Query timeout errors, slow refresh rates, and memory limitations can all impact the user experience and data currency. Solutions include incremental refresh strategies, data archiving policies, and query optimization techniques to maintain acceptable performance levels.
Visualization Rendering Problems occur when complex dashboards exceed platform capabilities or browser limitations. Chart display errors, filter malfunctions, and responsive design failures can all impact dashboard usability. Regular compatibility testing, browser optimization, and progressive enhancement strategies minimize rendering issues across different user environments.
Mobile and Responsive Design Challenges arise when dashboards fail to adapt effectively to different screen sizes and touch interfaces. Navigation difficulties, readability issues, and interaction problems limit mobile accessibility. Responsive design principles, touch-optimized controls, and simplified mobile layouts ensure a consistent user experience across all device types.
User Access and Permission Configuration becomes complex in large organizations with hierarchical data sensitivity requirements. Inappropriate access levels, data security breaches, and sharing permission conflicts create compliance and security risks. Implementing role-based access controls, data masking strategies, and audit trail capabilities maintains security while enabling appropriate data visibility.
Measuring Dashboard ROI and Success
Quantifying the business impact of advanced project management dashboards requires systematic measurement of both tangible benefits and operational improvements. Organizations must establish baseline metrics before implementation to accurately assess return on investment and justify continued platform usage.
Time Savings in Reporting and Analysis represents the most immediate and measurable benefit from dashboard implementation. Traditional manual reporting processes, which consume 8-12 hours per week per manager, can be reduced to 2-3 hours through automated dashboard solutions. This 70-75% time reduction translates to significant cost savings when multiplied across organizational management teams.
Improved Decision-Making Speed and Quality are evident through faster response times to project issues and more accurate strategic planning. Organizations report a 40-50% reduction in the time required for management decisions, while improvements in decision accuracy of 25-30% result from data-driven insights versus intuition-based choices.
Increased Project Success Rates directly correlate with comprehensive project monitoring capabilities. Organizations implementing advanced dashboards experience 15-20% improvement in on-time project delivery and 10-15% reduction in budget overruns. These improvements compound across project portfolios, generating substantial financial benefits.
Enhanced Stakeholder Satisfaction results from improved communication, increased transparency, and proactive issue resolution. Client satisfaction scores typically increase 20-25% when organizations provide real-time project visibility and predictive status updates. Higher satisfaction rates support client retention and business development opportunities.
Reduced Manual Reporting Effort eliminates repetitive data compilation tasks, allowing project managers to focus on value-added activities. Organizations typically achieve a 60-80% reduction in manual reporting workload, freeing resources for strategic planning, process improvement, and team development activities.
Better Resource Utilization and Planning optimization results from comprehensive capacity visibility and predictive resource modeling. Organizations report a 15-20% improvement in resource utilization efficiency and a 25-30% reduction in resource conflicts through enhanced planning capabilities.
Success measurement requires establishing KPI baselines before implementation, tracking usage adoption rates across organizational levels, and conducting regular ROI assessments to ensure continued value delivery. Quarterly reviews should evaluate both quantitative metrics and qualitative user feedback to guide platform optimization efforts.
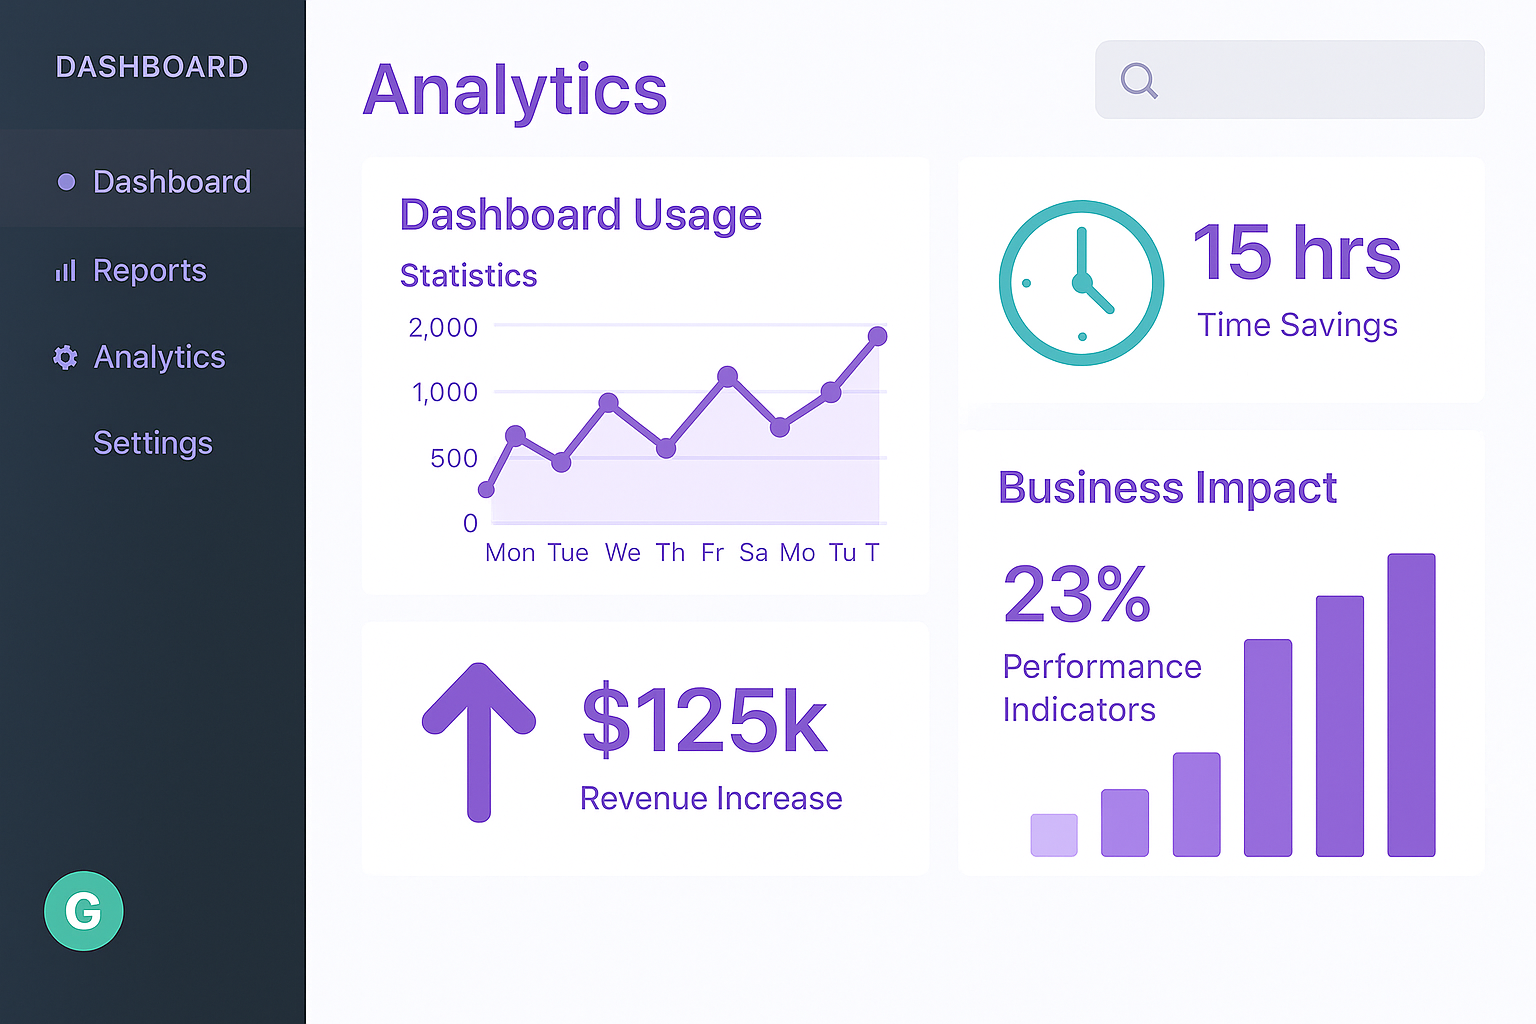
Measure tangible business benefits from the advanced project management dashboard implementation
Frequently Asked Questions
How long does it take to set up Power BI or Looker integration with Kanbanchi?
Initial setup typically requires 2-3 days for basic dashboard configuration, including establishing data connections, creating visualizations, and configuring user access. The complete implementation, including advanced features and organizational customization, typically takes 1-2 weeks. Organizations with existing BI infrastructure can accelerate timelines, while first-time deployments may require additional time for user training and process adaptation.
What are the costs associated with advanced dashboard platforms?
Power BI Pro licenses start at $10 per user per month, while Looker pricing begins around $2,000 per month for small teams. Additional costs include implementation services, training programs, and ongoing maintenance. However, organizations typically achieve ROI within 3-6 months through time savings and improved decision-making efficiency.
Can I create dashboards without technical expertise?
Both Power BI and Looker provide user-friendly interfaces designed for business users. Pre-built templates and drag-and-drop functionality enable the creation of dashboards without requiring programming knowledge. However, advanced customization and complex integrations may need technical support or specialized training for optimal results.
How often should dashboard data be refreshed?
Real-time refresh is ideal for operational dashboards monitoring active projects, while daily updates suffice for executive reporting and trend analysis. Refresh frequency should balance data currency requirements with system performance considerations. High-frequency updates can impact platform performance and data source availability.
What security considerations apply to dashboard implementations?
Dashboard security requires role-based access controls, data encryption, and audit trail capabilities to ensure secure access and data protection. User authentication, permission management, and data masking protect sensitive project information. Organizations should implement security policies aligned with compliance requirements and industry standards.
How do I choose between Power BI and Looker for my organization?
Power BI offers superior Microsoft integration, cost-effective licensing, and familiar user interfaces for Office 365 environments. Looker offers advanced data modeling, sophisticated analytics, and flexible deployment options to meet complex requirements. Organizational needs, technical infrastructure, and budget constraints should guide platform selection decisions.
Can dashboards work with existing Google Workspace or Microsoft 365 setups?
Yes, both platforms offer native integration with popular productivity suites. Kanbanchi’s Google Workspace integration enables seamless data flow, while Power BI’s Microsoft 365 connectivity ensures a familiar user experience. Existing authentication systems and data storage locations can be leveraged to facilitate a streamlined implementation.
You may also be interested in reading this article: 11 Principles of Project Management to Guide Your Project to Success.
Conclusion: Transform Your Project Data into Strategic Business Intelligence
Advanced project management dashboards represent a fundamental shift from reactive project monitoring to proactive strategic management. Organizations implementing comprehensive dashboard solutions experience measurable improvements in decision-making speed, project success rates, and resource utilization efficiency. The integration of Kanbanchi’s robust export capabilities with enterprise-grade platforms, such as Power BI and Looker, creates robust analytical ecosystems that transform raw project data into competitive advantages.
Kanbanchi’s native Google Workspace integration, combined with proven data export functionality, positions it as the optimal foundation for enterprise dashboard development. The platform’s comprehensive export capabilities, time tracking integration, and real-time synchronization provide the data richness required for sophisticated business intelligence applications.
Ready to transform your project data into strategic business intelligence?