How can I create a User productivity report in Kanbanchi?
You may create the User productivity chart in Kanbanchi. It provides a comparison of the users’ productivity in a period of time.
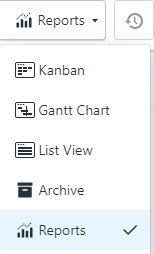
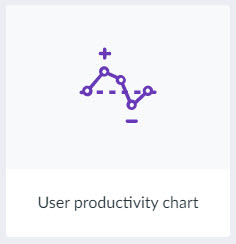
To create the User productivity chart, open the board you need and switch to Reports by clicking the drop-down list on the top panel near the board name. Choose Reports and then choose User productivity chart.
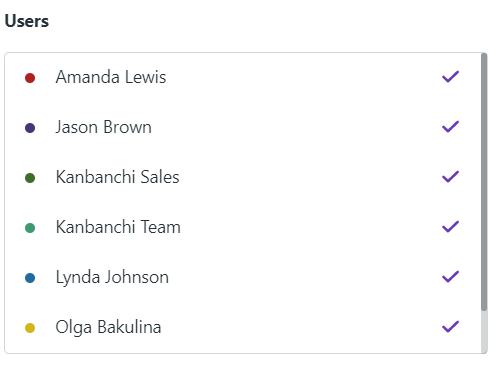
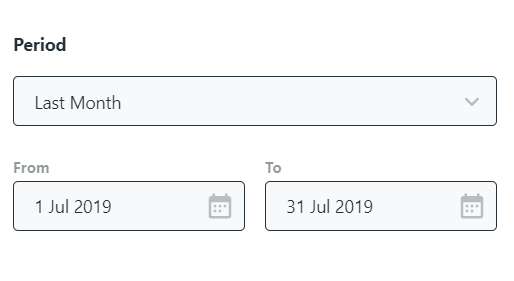
You may choose which users to display on the chart as well as the period of time.
The report has two modes: Detailed and Summary. The Detailed mode represents a chart with the number of cards shown on the vertical axis with a timeline being on the horizontal. The chart shows the number of done (solid graph) and overdue (dotted graph) cards for each user in each at a particular point in time.
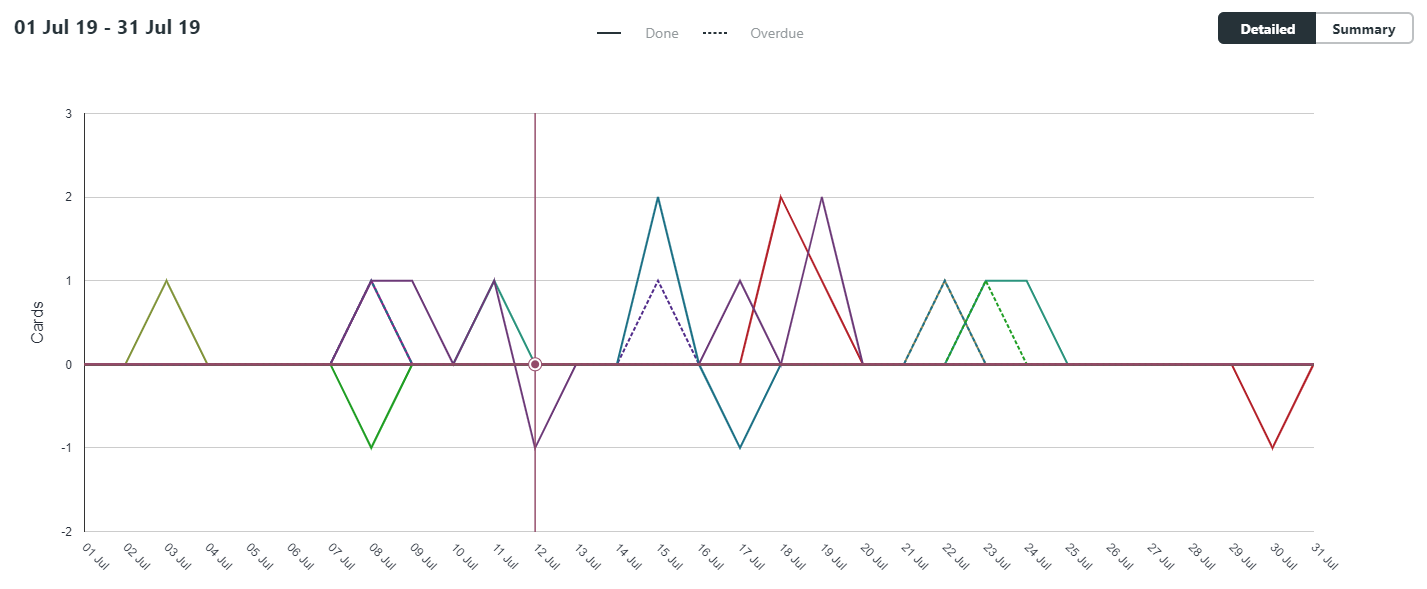
Hover the cursor alongside the chart lines to see the information about the particular date.
The Summary mode represents a bar graph with the number of cards shown on the vertical axis with users being on the horizontal. Two bars are created for each user. They show the total number of done and overdue cards in the chosen period of time for the user.
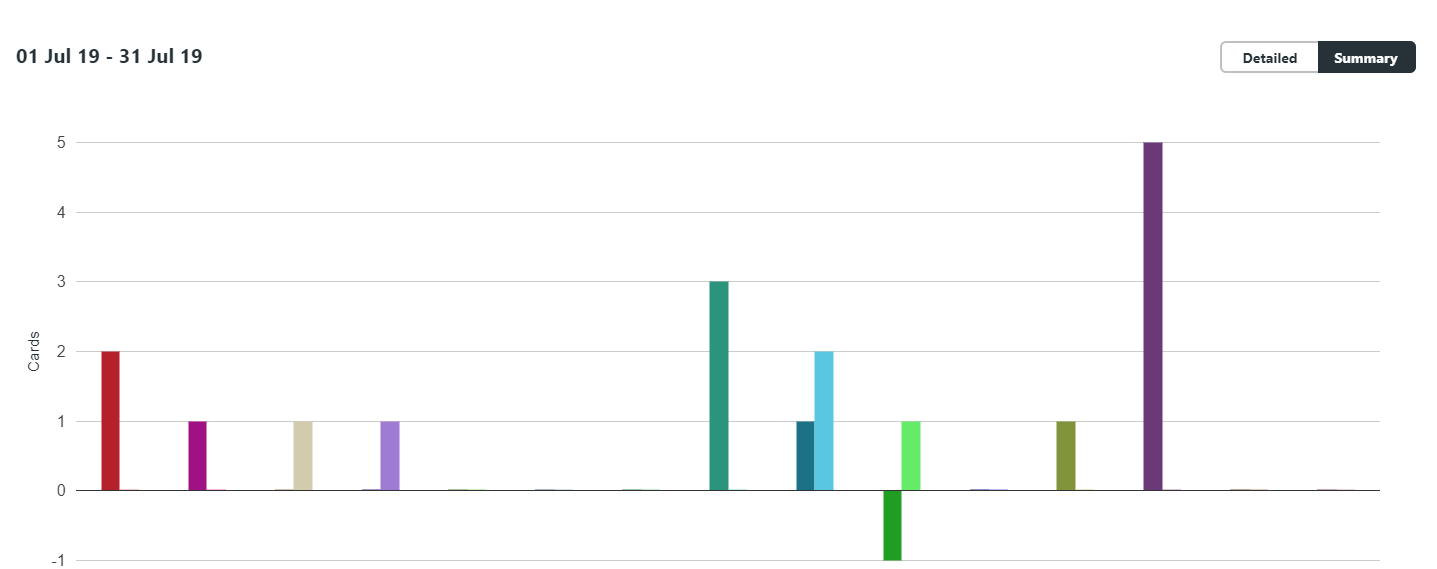
Hover the cursor alongside the bars to see the information about the number of done and overdue cards for each user.
Please note: the number of done cards may become negative. It may happen when a done card is marked as undone.