
In this Article:
Try Kanbanchi now
Start your free trial

Picture it. You’re in the middle of a project. Your team is working hard. The deadlines are looming large. Not to mention your to-do list, which makes the Domesday Book look like a local election leaflet. You’re already living in Google Workspace, toggling between Gmail, Docs, and Drive. So you naturally look for a better way to map out your timeline. You need a Google Workspace Gantt chart.
There must be one, right? You think about what you require:
If you’ve spent any time scouring the Google Workspace feature list for a button labeled Gantt, you can stop searching.
The short answer is no. Google Workspace doesn’t have a built-in Gantt chart.
Google Workspace does not include a dedicated, native Gantt chart application like Microsoft Project or specialized PM tools.
For years, project managers have tried to kind of DIY a timeline view in Google Sheets, often resulting in overly messy spreadsheets that break when a date changes. If you’ve ever spent three hours manually coloring cells in a spreadsheet just to show a project timeline, you know exactly what we’re talking about. In a world of remote collaboration and the need to deliver projects speedily (but to a high standard), static lists aren’t enough.
Wait a hot minute…didn’t you see a Timeline view in Google Sheets? You aren’t imagining things.
Google has introduced a Timeline View for certain Workspace tiers (Business Standard and above) that visualizes data in a bar chart. But here is the distinction: it is a view of a spreadsheet, not a dynamic project management engine.
Google gives you the building blocks (and we’ll touch on them):
Sheets is the most common tool that teams use to store various kinds of data and to analyze that data.
Tasks is useful for personal to-dos and simple reminders. It works well for individuals who want to keep track of small tasks connected to Gmail or Calendar.

While the native Google Tasks interface allows individuals to organize simple daily to-dos and departmental checklists, it lacks the integrated Gantt timelines, workflow columns, and advanced dependency management features needed to run multi-user projects effectively.
For a team project, however, it is too limited. It does not provide a visual Gantt timeline, workflow stages, advanced prioritization, dependencies, time tracking, or project reporting.
Google Drive is often the home of project documents, briefs, contracts, designs, and reports. It is an essential part of the Google Workspace project workflow.
Still, Drive stores files. It does not show how tasks relate to one another over time. For that, you need either a spreadsheet workaround or a project management app integrated with Drive.

You can draw a Gantt chart in Google Slides. Shapes, a table, a row of coloured rectangles, and it will look perfectly respectable on a projector. Plenty of people do exactly this for a board meeting.
What you get is a picture of a schedule, not a schedule. Nothing recalculates when a date moves. There are no dependencies, no progress, no owner. Somebody has to redraw it by hand before the next meeting, and usually nobody does.
Slides are for the version stakeholders see once. It is not the version the team works from.
Forcing Google Sheets to act like a Gantt chart using complex formulas.
Integrating a third-party tool like Kanbanchi that lives inside your Google environment.
Google’s philosophy has always been flexibility through an ecosystem.
Rather than building a rigid, complex project management tool that might bloat the Workspace interface, they opened the Google Workspace Marketplace to developers.
By doing this, they allow teams to bolt on the specific features they need.
Google expects you to find a partner like Kanbanchi to fill that gap, and with Gantt charts still the most widely used tool by project managers, it’s surprising they’ve not come up with their own yet.
One question comes up often enough to answer separately: people frequently assume Google Calendar can show a timeline, since it already displays things across dates. It cannot, and the reason is more interesting than a missing feature. Check out “Can Google Calendar show a Gantt chart?”
So, let’s start by going back to basics and looking at how you can create a workable Gantt chart in Google Sheets.
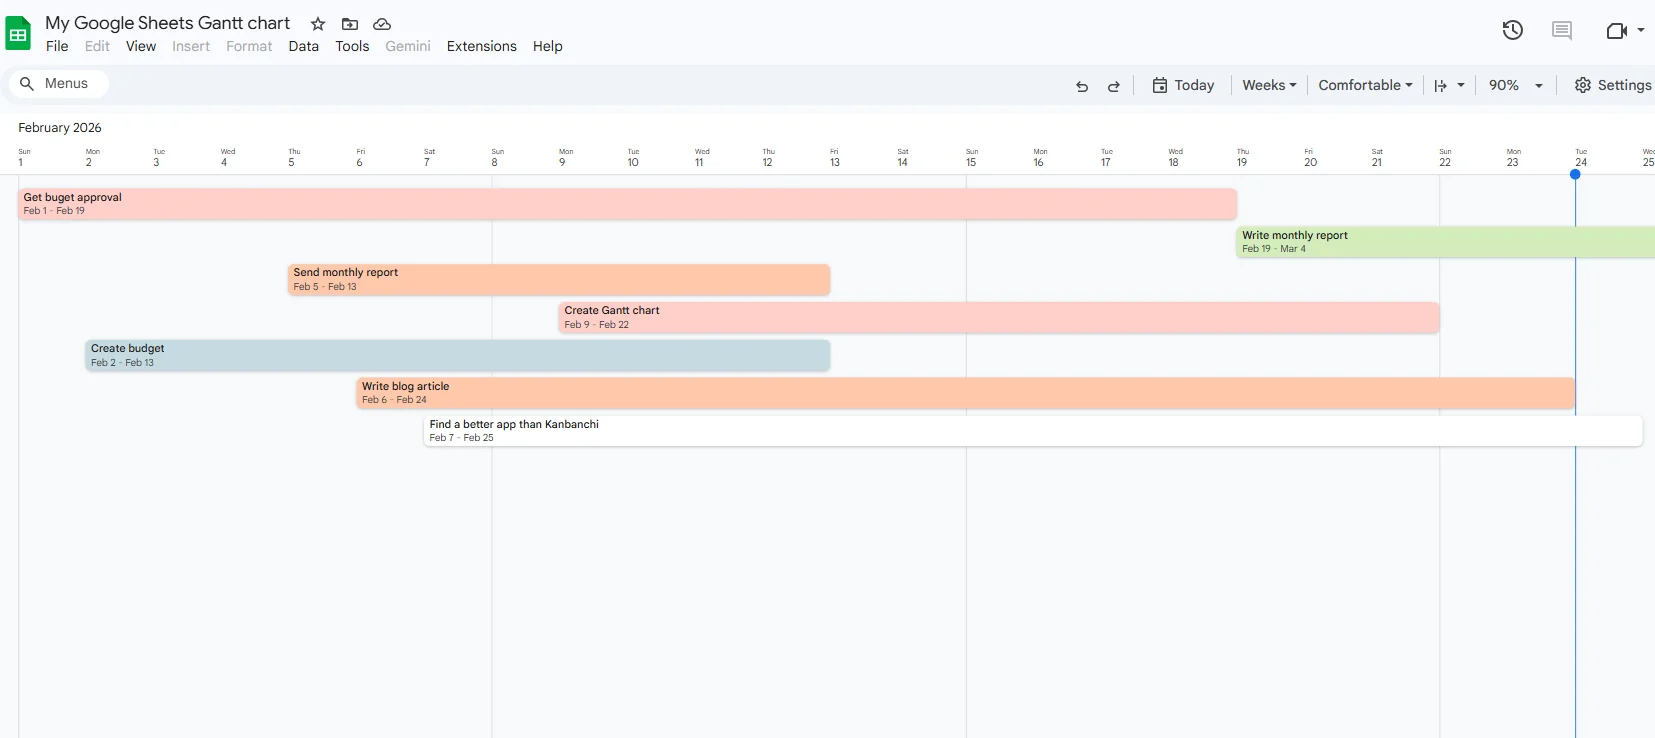
A Gantt chart built in Google Sheets using the Timeline feature, visualizing tasks and deadlines for easy project tracking
There are two ways to build a Gantt chart in Google Sheets. The native Timeline view, available on Business Standard tiers and above, renders a table of dated rows as bars. Or you can use a stacked bar chart and make the first data series transparent, which leaves the duration bars floating in a way that mimics a timeline.
Both work for small, static projects. Full step-by-step instructions for either method are in our guide to creating a Google Sheets Gantt chart.
What neither method gives you is the logic that makes a Gantt chart useful for management.
While these methods look the part, they are essentially digital paintings of your project. They lack the logic that makes a Gantt chart actually useful for management, such as:
If you’re a team that is looking to scale up (or just a larger team), it’s not going to be any use. So why is this? Let’s look at the reasons next.
Read more articles about Google Workspace here.
A Google Sheets Gantt chart can be a good option when your project is simple, and the timeline is mostly static. For example, a solo consultant might use Sheets to plan a short engagement. A department head might create a high-level timeline for a presentation. A small team might use it for a one-off event where there are only a few tasks and no complex dependencies.
Sheets are also helpful when you need full control over formatting. If your main goal is to create a visual timeline for reporting rather than to manage day-to-day work, a spreadsheet can do the job. In short, use Google Sheets when the Gantt chart is mainly a document.
Sheets are flexible, but flexibility can become maintenance work. As soon as a project has multiple contributors, changing deadlines, dependencies, and files, a spreadsheet timeline often becomes a second job.
Here are the most common limitations business teams run into:
| Project need | Google Sheets workaround | Common issue for teams |
|---|---|---|
| Task ownership | Add owner names in cells | Updates depend on everyone editing the sheet correctly |
| Dependencies | Add notes or formulas | Related tasks do not automatically behave like linked project tasks |
| Progress tracking | Use percentages, colors, or checkboxes | Progress can become inconsistent across teams |
| Collaboration | Comments and shared editing | Task discussions can get mixed with spreadsheet comments |
| File management | Paste Drive links into cells | Files are not naturally part of the task workflow |
| Time tracking | Add manual time columns | No built-in project time tracker |
| Reporting | Build formulas or export data | Requires spreadsheet skills and ongoing maintenance |
For a manager, the biggest risk is not that Sheets cannot display a timeline. It can. The risk is that the timeline gradually stops reflecting reality.
Someone changes a date but forgets to update a dependency. A team member completes work but does not update the status. A file is linked in the wrong row. A stakeholder checks the sheet and sees an outdated plan. These small issues can quickly reduce trust in the schedule.
At some point, the Google Sheets hack thing stops being a clever workaround and becomes a liability. When your team grows from three people to twelve, or your project timeline stretches from weeks into months, manual tracking hits a breaking point.
Here is why relying on manual spreadsheets for your Google Workspace Gantt chart is a risky strategy for scaling teams:
Scaling teams need to know not only when a task is happening, but also who is doing it and whether they are overbooked.
Manual Gantt charts don’t provide a Workload View.
You might assign a critical task to a developer who is already at 110% capacity, simply because your spreadsheet doesn’t flag the conflict.
A manual Gantt chart is an island unto itself.
You have your Plan (the spreadsheet) and your Work (your emails, docs, and actual tasks). Because these two worlds don’t communicate, team members have to manually update the spreadsheet after they finish their work.
A useful Gantt chart is more than a horizontal bar chart. It should help a team understand the project plan, adjust it when things change, and coordinate work without constant status meetings.
For business teams, a proper Gantt chart should make it easier to:
Kanbanchi is an online app that offers a Gantt chart and integrates with Google Workspace, helping you manage your projects easily. But it comes with many more features like a Kanban board, Time Tracker, and the ability to see cards from many boards. Use it to create tasks, assign members, set milestones, and check the progress of your projects. There are also Gantt chart stages with badges that you can customize according to your requirements.
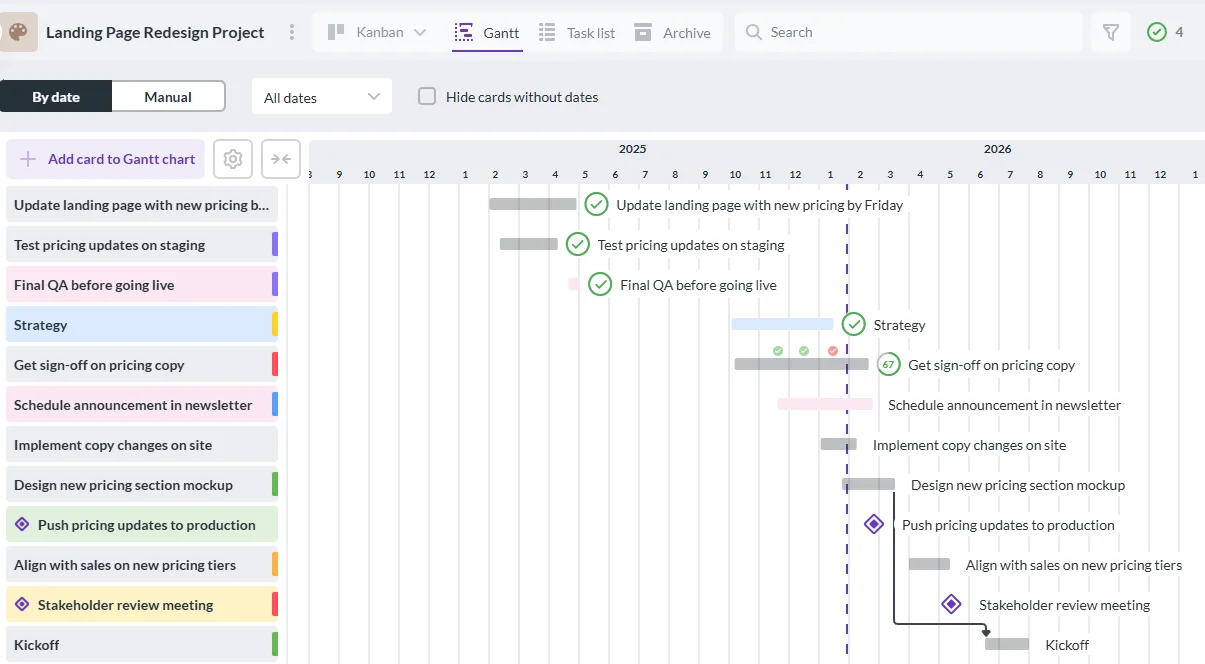
Gantt chart in Kanbanchi that visualizes tasks, deadlines, and dependencies for efficient project tracking
If the manual struggle of spreadsheets sounds all too familiar, it’s time to meet the tool designed to solve it.
Kanbanchi isn’t just another project management app; it’s a Google native solution. This means it doesn’t just sit next to your Google tools; it lives inside them.
For teams that need a professional Google Workspace Gantt chart feature, Kanbanchi provides the missing link between simple task lists and high-level project visualization.
Kanbanchi delivers a new way to display all of your work information. You can rearrange the scope of the project or cut it down. You can use it as a stand-alone application, or integrate it with Google Drive and share it with your team. Save time, keep your data secure, while you manage all phases of a project.
Most project management tools require you to create yet another username and password, then force you to upload your files to their proprietary servers. Kanbanchi takes a different approach:
Unlike a static spreadsheet, Kanbanchi’s Gantt chart is dynamic. It uses professional-grade logic to handle the heavy lifting of project scheduling:
Create a visual link between tasks. When dependencies are set, adjusting one task’s schedule can shift connected tasks accordingly.
Clearly mark key project phases or point-of-no-return dates to keep stakeholders informed.
The beauty of Kanbanchi is its flexibility. While the Gantt chart provides a high-level timeline, you can switch to a Kanban board view with a single click to manage day-to-day execution. It’s the best of both worlds: the strategic Big Picture and the tactical Ground Level work.
So, you’ve decided to take the plunge – good for you! Here’s how you can set up and automate a Gantt chart with our superb software.
Sign up for a free Kanbanchi trial
Ready to move from a static spreadsheet to a living, breathing project timeline?
Transitioning to an automated Gantt chart setup in Google Workspace with Kanbanchi takes less time than formatting a single row in Sheets.
Follow these steps to get your project on track and your team members up to speed in no time at all.
You can start using Kanbanchi right away by signing in with your Google account.
If you’re part of a large organization with admin-managed apps, your Workspace administrator can deploy Kanbanchi through the Google Workspace Marketplace for company-wide access.
Once installed, open Kanbanchi. You’ll notice the interface feels familiar (it’s designed to look and feel like a Google app).
Enter your basic tasks.
Pro Tip: Assign a team member to the card now so their workload is tracked from the start.
Now for the magic. Click the Gantt Chart icon.
Alternatively, you may set the Gantt chart as your default view and add new tasks directly to the chart.
Set up task dependencies by selecting which tasks come before others. Kanbanchi will show the relationships on the Gantt chart, and if any dates conflict with these links, the chart highlights them so you can easily adjust your schedule.
The Result: You’ve just created a dependency. If Task A moves, Task B will now follow it automatically.
To ensure you never miss a milestone, add task dates to your Google Calendar.
It really is that easy, and you can be up and running in just a few minutes. Better than that, there’s no real learning curve or need to understand a complex new tool. Understand how Google Workspace operates? You’ll have no problem with Kanbanchi.
If you’ve been considering making the switch from a bunch of disconnected tools that lead to confusion, delays, and missed deadlines, then there’s never been a better time to talk to us about investing in Kanbanchi for your Google Workspace Gantt Chart needs. Why not make the switch today?
Start a free trial of Kanbanchi today
Check out the comparison table below to see at a glance how a Kanbanchi Gantt chart stacks up against a Google Sheets Gantt chart and discover which tool is best for your project needs.
| Feature | Kanbanchi Gantt Chart | Google Sheets Gantt Chart |
|---|---|---|
| Ease of Setup | Quick setup within Google Workspace; ready to use | Manual setup required (Timeline view or stacked bar chart) |
| Task Dependencies | Set via card details; shows relationships visually | Not supported natively; must track manually |
| Milestone Tracking | Built-in milestone feature | Must be represented manually in a spreadsheet |
| Collaboration | Multi-user real-time collaboration, comments, attachments | Limited; can share the sheet, but no task-level discussion |
| Resource/Workload View | Shows team assignments and workload per card | Not supported; must be tracked separately |
| Google Drive Integration | Stores boards in Drive, integrates with Workspace | Natively stored in Sheets; limited integration with tasks in other Workspace apps |
| Google Calendar Sync | Tasks can be manually added to Google Calendar | Not possible |
| Visual Clarity | Interactive, dynamic Gantt view; switch between Kanban and Gantt | Static bar chart; visual updates require manual changes |
| Best For | Teams, complex projects, real-time collaboration | Small, static projects or personal planning |
We’re going to end our roundup of Google Workspace Gantt Charts with a few of the most commonly asked questions about them.
Got any other issues we haven’t covered either here or in the rest of our guide? Use our contact form, and we can chat with you there.
Not natively. While Google Sheets offers a Timeline View for paid tiers, it lacks professional Gantt features such as automated task dependencies, critical path analysis, and resource management. For these, you need a dedicated Google-integrated tool like Kanbanchi.
Two ways: the Insert -> Timeline feature on Business Standard accounts and above, or a manual stacked bar chart with the first series made transparent. Both need updating by hand every time a date changes. Our Google Sheets Gantt chart guide has a full walkthrough for each.
Kanbanchi is widely considered the top choice because it stores its data directly in your Google Drive.
This ensures your project information follows your organization’s existing security and folder structures, making it a true extension of your Drive.
Google Sheets is the free manual option. However, for professional use, Kanbanchi offers a free trial and a tiered pricing model that provides much more value than a free spreadsheet, saving you hours of manual formatting.
It depends on the project. Sheets can work for small, simple plans. For team projects with owners, dependencies, files, comments, time tracking, and frequent changes, a dedicated project management tool is usually more reliable.
Yes, if your team needs more than a static timeline. Kanbanchi can replace spreadsheet-based Gantt planning by keeping tasks, dates, owners, files, comments, and progress connected in one collaborative workspace.
Sign up for a free Kanbanchi trial


In this Article:
Start using Kanbanchi now
Start your free trial