In this Article:
Try Kanbanchi now
Start your free trial


There is a good chance that you have heard about any Gantt chart tool before now but do you know what they do? Even more importantly, do you understand how using them well can benefit you and your future projects?
First created by Henry Laurence Gantt in the early 20th century, this is a clever, visually appealing way of staying on top of a project. The simplest way of describing a Gantt chart is as a way of visualising the progress of a piece of work.
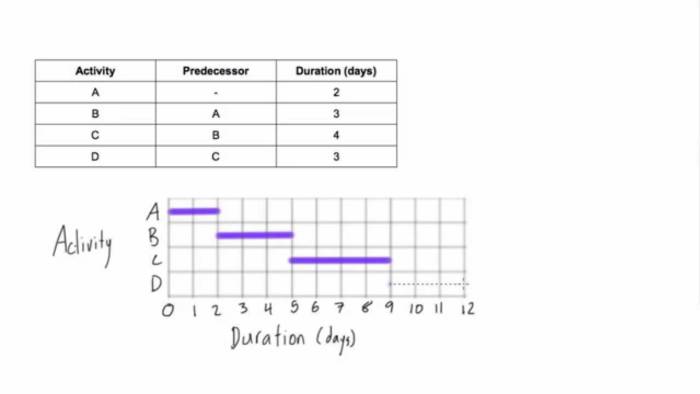
In its most basic form, this is a list of the tasks to be done, organized in such a way that you can understand at a glance what is coming up next. The important dates, the duration of the task and how it links to other tasks can all be easily seen on one chart.
This type of tool can be used for simple projects as well as for highly complex pieces of work. Once you understand how to create, use and read a Gantt chart you can use them in any type of project of any size.
There are numerous reasons why Gantt charts are so widely used these days. The simple perfection of this approach brings with it a range of useful benefits.
As we have seen, there are some very good general benefits to adopting a Gantt chart approach. Yet, you may wonder how it could specifically help you. What exactly can it add to your business that makes it worthwhile?
As mentioned earlier, this kind of project tool has been around for a very long time. The earliest versions were simple, handwritten graphs that covered the most basic information and were filled in as the project progressed.
The arrival of the computing age allowed us to begin to use Gantt chart tools much more effectively. Now we can update them instantly, maintain different versions and keep everything impeccably tidy no matter how many changes they undergo.
Cloud computing has also taken this approach to a different level. It is now possible to collaborate in real-time with colleagues all over the world. The agility and flexibility provided by these advances make running even extremely complex projects a pleasure.
There are many Gantt chart tool options around these days. This is a busy, competitive market that has something that is right for every need.
Gantt chart is the tool that we recommend for keeping your projects easy to understand and always on the right track. With a user interface that is simple, clear and intuitive to use, this is a tool that anyone can pick up almost instantly.
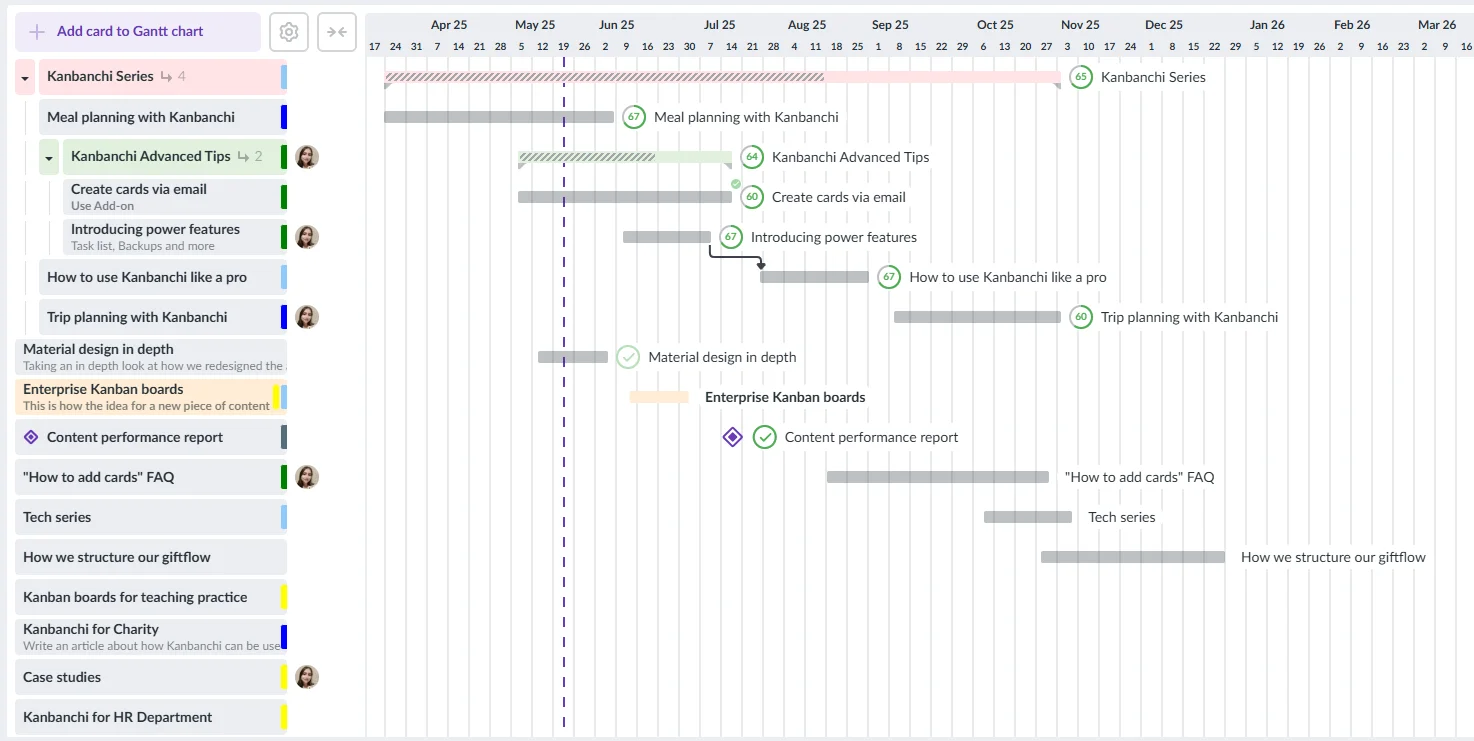
Even more beneficial is the fact that the chart is combined with a Kanban board. In this way, you can plan tasks on the Gantt chart before moving them on to the Kanban board to go through the workflow stages. Also, this powerful combination allows you to switch between the Gantt chart view and the Kanban view to focus on some particular aspects of your workflow.
This agile and highly flexible way of working can be used in any type of industry and with projects of varying degrees of difficulty and complexity.
Discover how easy your life becomes when you use the Kanbanchi approach to planning and running your projects.


In this Article:
Start using Kanbanchi now
Start your free trial