In this Article:
Try Kanbanchi now
Start your free trial


A Gantt chart can be a very helpful tool for team tasks and project management. It is a stacked bar chart that allows you to see the different tasks in a calendar-like visualization. On the horizontal axis, you see the calendar. On the vertical axis, you see the task, each on its row, with the length reflecting the task duration.
Google Workspace still does not have a Gantt chart tool. However, in November 2022 they released the Timeline feature for Google Sheets. With this feature, you can create a free Gantt chart inside a spreadsheet. In this tutorial, we are gonna teach you how to use the Timeline feature to create your very own Gantt chart visualization.
We have included some cool features that make it more useful and better looking, like a progress tracker, status, and tags. If you want, you can follow the steps to create your own spreadsheet (10 minutes).
At Kanbanchi we are all about making your life easier. If you don’t wanna follow the tutorial, here is the template of our final Gantt chart in Google Sheets. You can just open the link, make a copy of the spreadsheet, and start using the Gantt chart right away.
Create a spreadsheet and name your columns. The name and order of your columns do not need to be the same as mine. However, it is imperative that you have a task name column and columns for the task’s start date and end date.
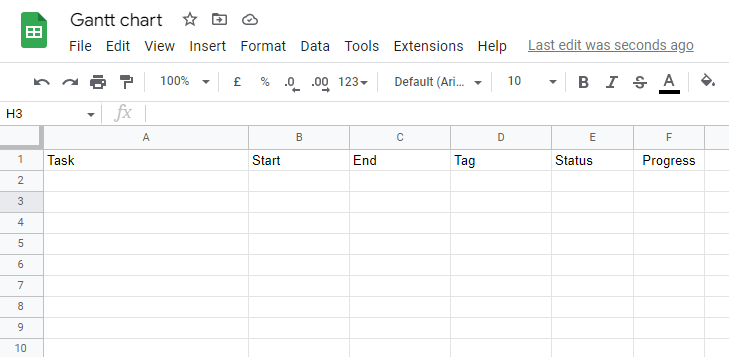
The other columns are optional. If you want to have a Kanban board like progress management you can also add a Status column. Another cool possible feature is a column for tracking late vs on-time tasks and a tag column, so you can group your tasks by sector or work type.
(Steps 2 through 4 are optional, but they will make your Gantt chart easier to understand and help you make the most of it.)
The timeline feature is very useful for monitoring all your tasks. However, depending on the number of tasks you have, it might become too demanding to enter all the information manually. On top of that, if you happen to type some value wrong, for example use the wrong date format, Google Sheets won’t be able to add it to the Gantt chart. To avoid that problem, we use data validation. That way, you can preset the values for your columns, and will never enter invalid data into your table.
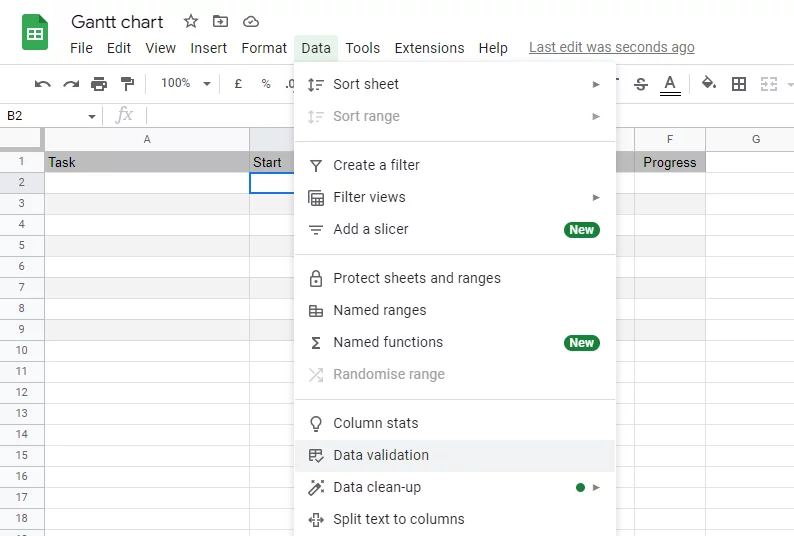
For the date columns, select the columns and click Data > Data validation > + Add rule and select the Criteria “Is valid date”. That way, when you double-click a date cell, a calendar will pop up and you can simply select the desired date. With this visual calendar, there is no way you are gonna type the wrong date by mistake.

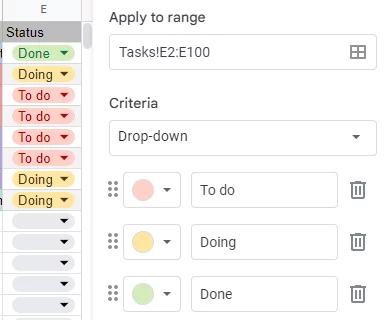
For the status column, navigate to Data > Data validation > + Add rule and select “Drop-down”. Next, you will enter whatever and as many values as you want. I used the classic “To do”, “Doing” and “Done”, like a Kanban board.
The formatting of your table will extend to your Gantt chart. However, you don’t want to have to manually color your table. So, for the Tag column, we use the conditional formatting feature. That way, your tasks will be color-coded according to the value you insert in the cell.
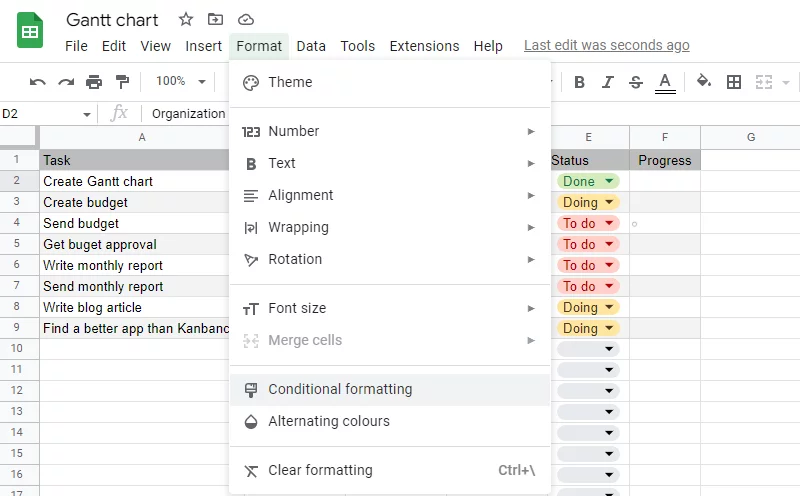
To create the conditional formatting, you are going to click Format > Conditional Formatting and then click + Add another rule. Chose the style of your cell, then from the dropdown list select the rule “Is equal to“, and enter your tag’s value. Repeat that for each tag you want to have.
Once you are done, you should extend the rule to the entire column. You can do that by either using the paint format brush or dragging the corner bottom square down to the rest of the column.
Same as with the Date and Status columns, you can create a data validation rule that will only accept values from a drop-down list. Just remember that if you do so, every time you want to add a new category to your tags, you will have to create new formatting and validation rules.
One valuable aspect of a Gantt chart is helping you with organization, so you never miss a deadline. But so far, the only way of knowing if you are on schedule with your tasks is by looking at the due dates and comparing them to the current date. To avoid having a delay going unnoticed, it is very helpful to have some visual warning that you are late.
To create the visual warning, I thought using emojis would be the best. If you prefer, you can use words or other symbols. All you have to do is create a formula of nested IF statements that check the status and the dates of your tasks. If the task is not “Done”, it will check if you have the current date is later than the end date. If it is, it will show you the alarm clock to let you know you are late.
I have used ⏰ for late, for on time, and ✔️ for done, but you can use whatever emojis or words, or symbols you want. Simply copy and paste this formula and apply it to the cells in the appropriate column.
=IF(C2=””,””,IF(E2<>”Done”,IF(today()>C2,”⏰”,””),”✔️”))
* If you changed the orders of your columns, make sure to update the cells referenced in the formula to match the right columns.
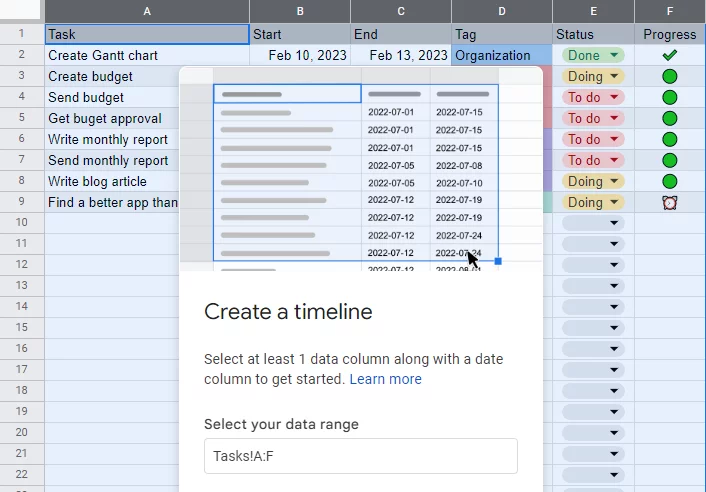
Start populating the table with your own tasks. Once you are done, you’re going to select the range of your data and click on Insert > Timeline > OK. If you don’t want to have to reselect the range later, you can just already select the entire columns. Now you are gonna have a “Timeline” tab in your spreadsheet with your Gantt chart in it.
Since we are using Google Sheets, this is a dynamic Gantt chart. It will automatically calculate the task durations and update the progress warnings. You don’t need to worry about refreshing your chart.
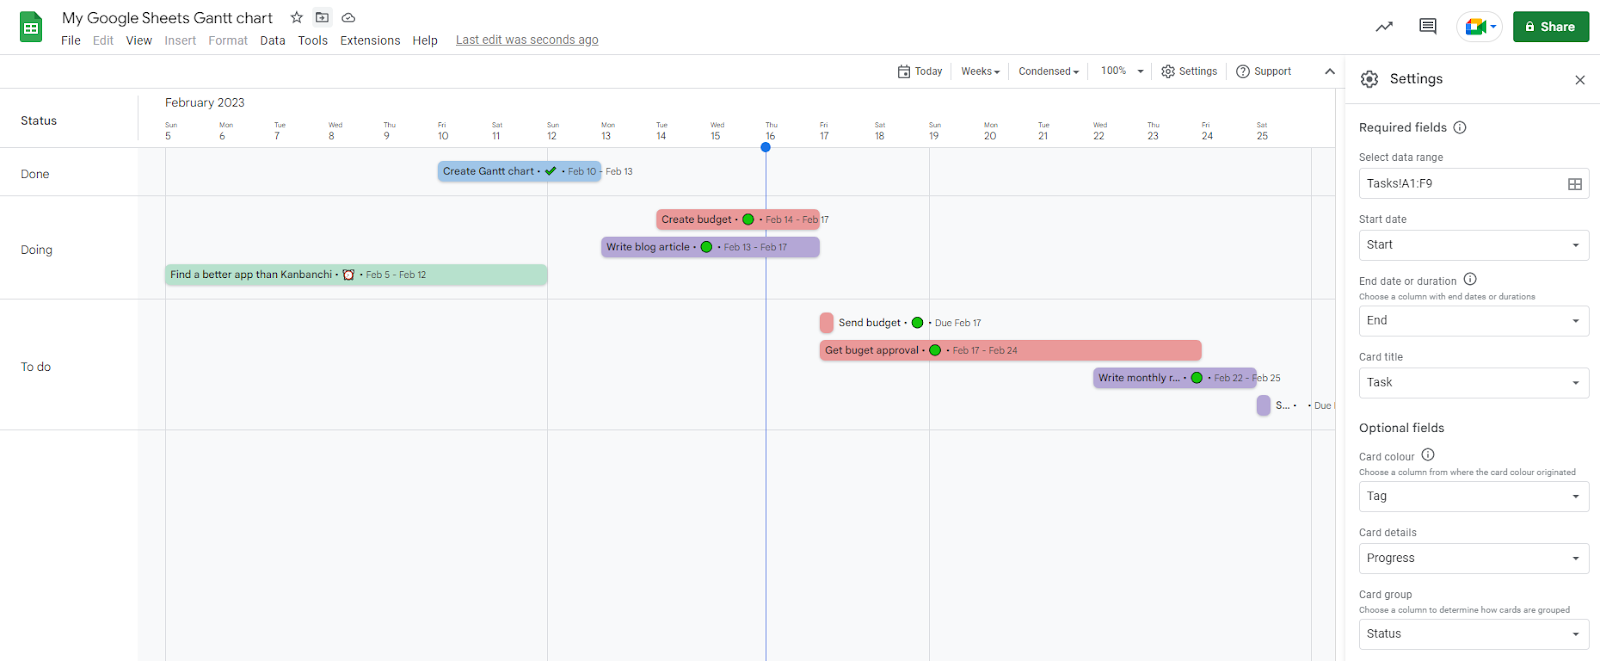
You have already created your Gantt chart and inserted data into it. Now all you have to do is configure it to project data from your table into the chart. Click Settings to open the chart editor menu, then add Start as your Start date, End as your End date or duration, and Task as the Card title. At this point, you will already be able to visualize your tasks in the Gantt chart.
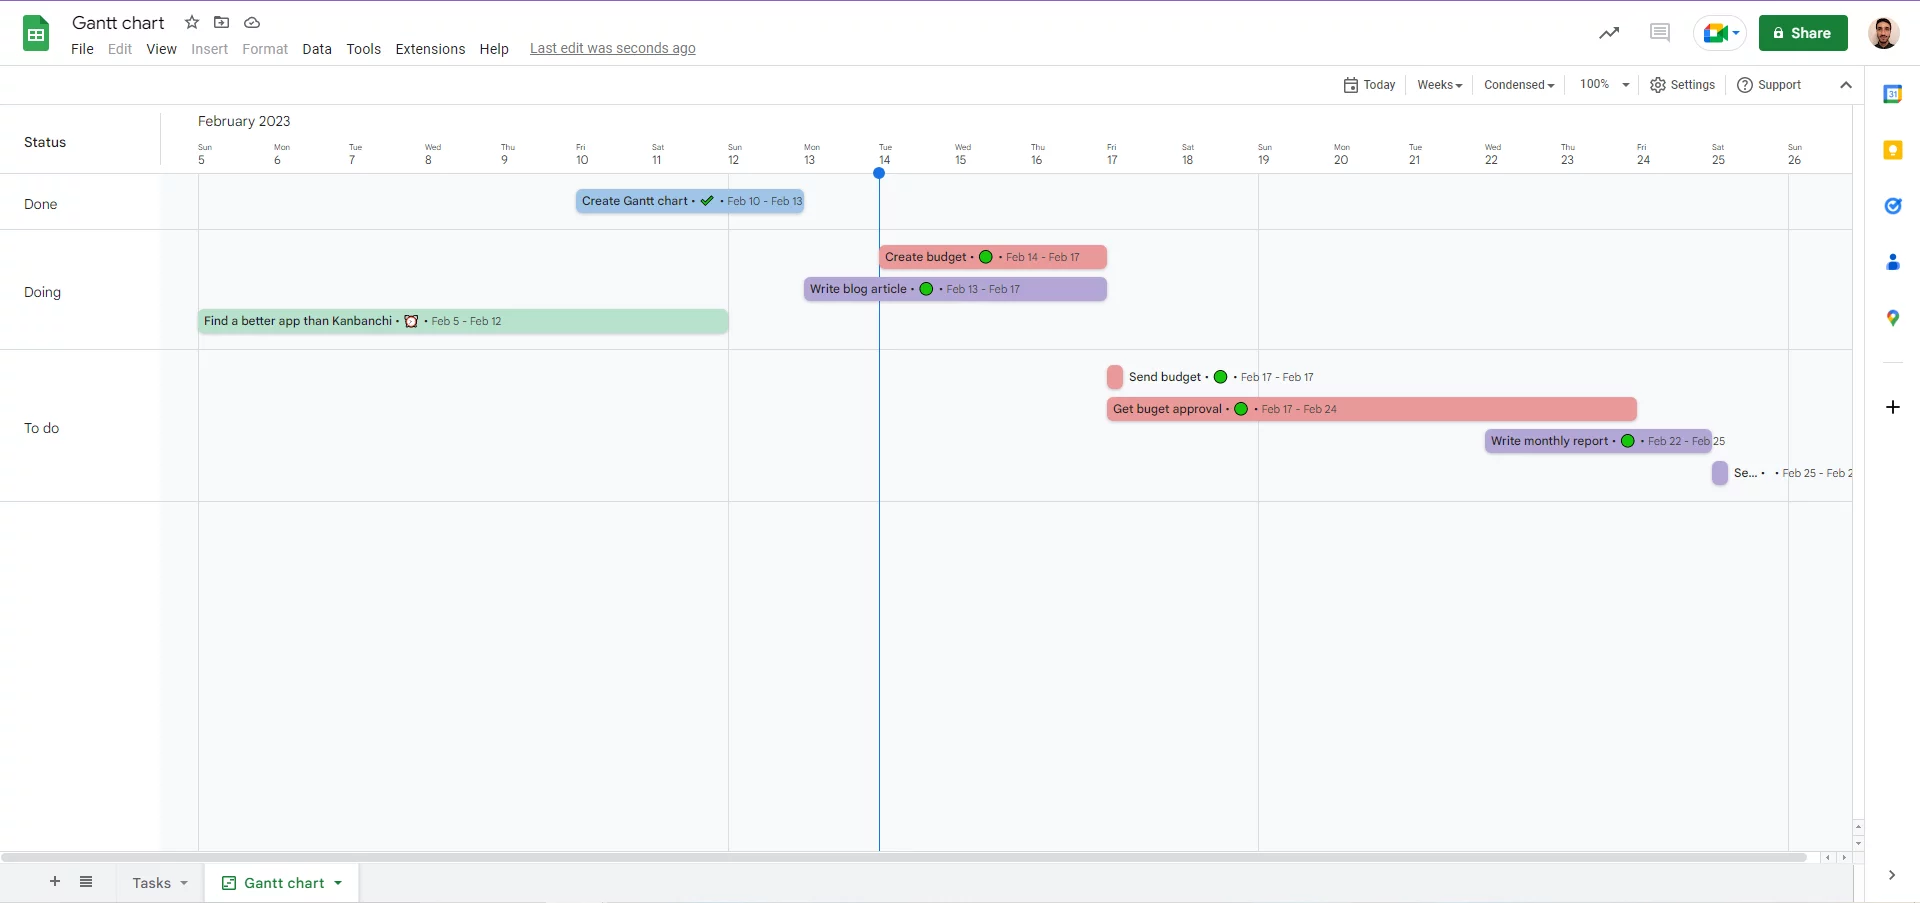
If you followed the optional steps (2 to 4), you can now add Tag as the Card color to create the color coding of your Gantt chart. To see your progress waning, you should add Progress to your Card details. Finally, you can choose to set the Card group to Status if you want to see the gantt Chart tasks organized by Status or to Tag if you wanna have them grouped by Tag value.
If you followed the optional steps, this is what your final Gantt chart will look like:
Now you are ready to start creating Gantt charts in Google Sheets. You can have a Gantt chart with project tasks colored-coded by their tag value, with emojis to show their progress warning, and grouped by their tags or status.
Of course, this is a very basic Gantt chart, and it might not be enough for your needs. There are no complex features, such as task dependencies, time trackers, an integrated Kanban board, or Reports, and it lacks a User Interface. On top of that, you are gonna have to manually delete and update tasks in your spreadsheet, which can become pretty time-consuming.
If these become a problem for you, it might be time to consider getting a Project Management tool like Kanbanchi. It is the #1 Project Management tool for teams using Google Workspace. It integrates perfectly with other Google Products and has a friendly interface and is easy to learn, with almost no learning curve.
More articles to read:
Gantt Chart for Google Workspace
How Can a Gantt Chart Tool Help You with Your Projects?


In this Article:
Start using Kanbanchi now
Start your free trial