Try Kanbanchi now
Start your free trial


For any project, it’s crucial to track team performance. It may be challenging as the project timelines vary and change, people move, deadlines come closer… and so on. We are pretty sure you need some kind of a team performance chart to visualise everything that’s in your head as a team leader.
A million of harmful thoughts appear in your head, for example:
All these spoils your mood and reduces the ability to work, and hello, the twitching right eye (or left, maybe …)
The thing is, that it is not easy to keep track of everything. Collecting, measuring, and analyzing data about the whole team takes a lot of time and often is simply impossible. That is why every project manager faces the problem “how to determine and correct problem issues if you’re unable to see how the team is performing?”
Yes! Of course, now the idea that you have an opportunity to see your actual team’s performance might sound like a dream!
But just imagine a smart gauge of all the issues you worked on during the last month or an exhaustive list of overdue, open, and completed tasks!
Could you?
And what a pleasure to see a 100% completion rate confirmed with graphs created with data coming straight from your main project management app!
Still, are not sure it is possible?
It will help you to get the insight into your team members’ progress in one mighty report.
Control over tasks, projects and deadlines is not easy. But with Team Performance Chart all you have to do is to find out areas of improvement, define trends and then just set realistic goals for the whole team. Good news: tiresome data collection with scouring your calendar for current project updates is no longer necessary.
As tracking your team becomes much easier you receive enough time to make timely adjustments and thus raise your team’s productivity.
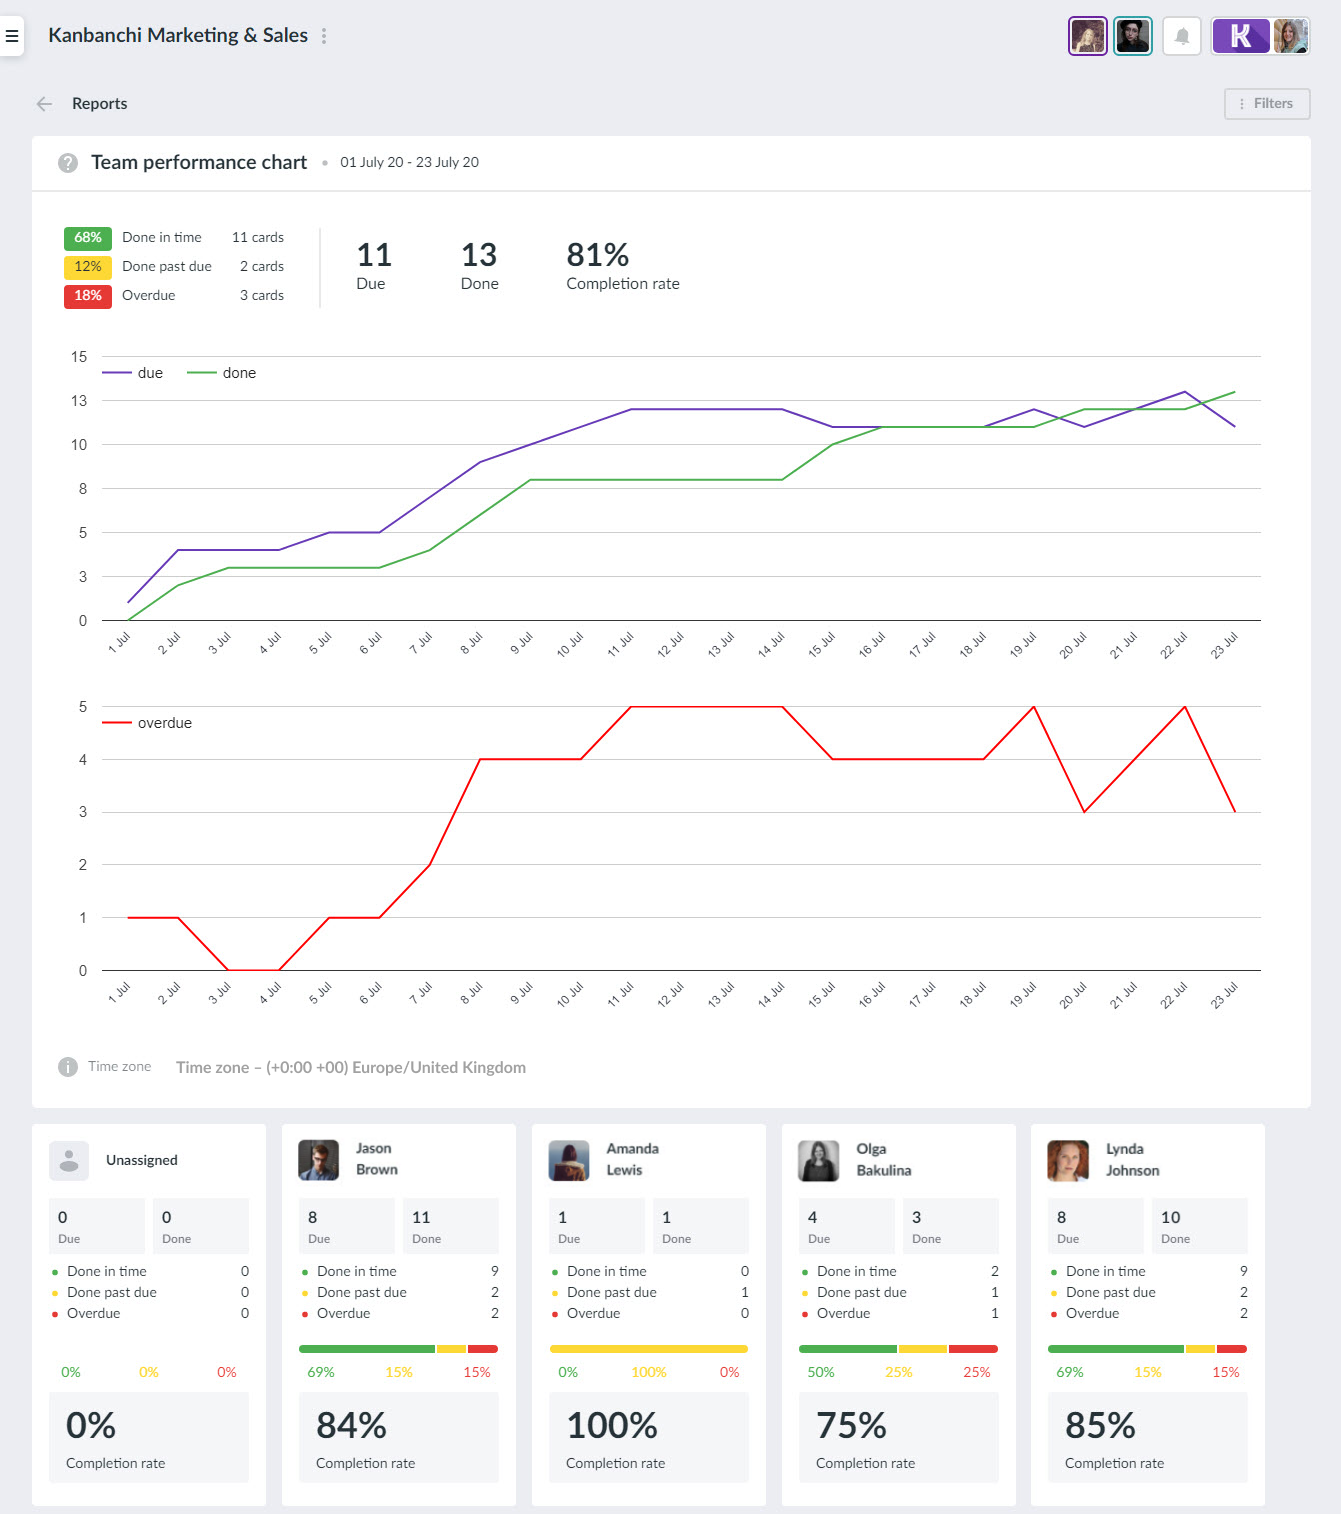
Look at how you can make Team Performance Chart work for you. Open the board you need. To create the team performance chart open the left-side navigation panel, hover your cursor over the switcher in the bottom and choose Reports. Click the Team performance chart. Your screen will look something like this:

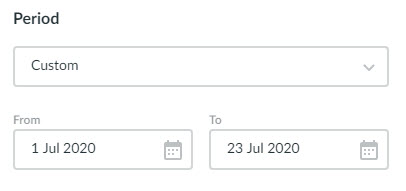
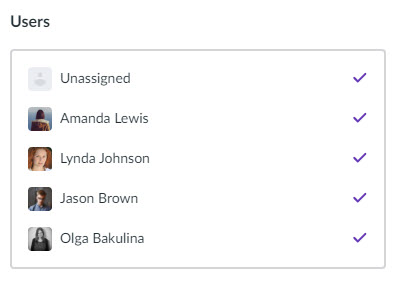
Start with specifying your date range, and then choose which users to include to the report.
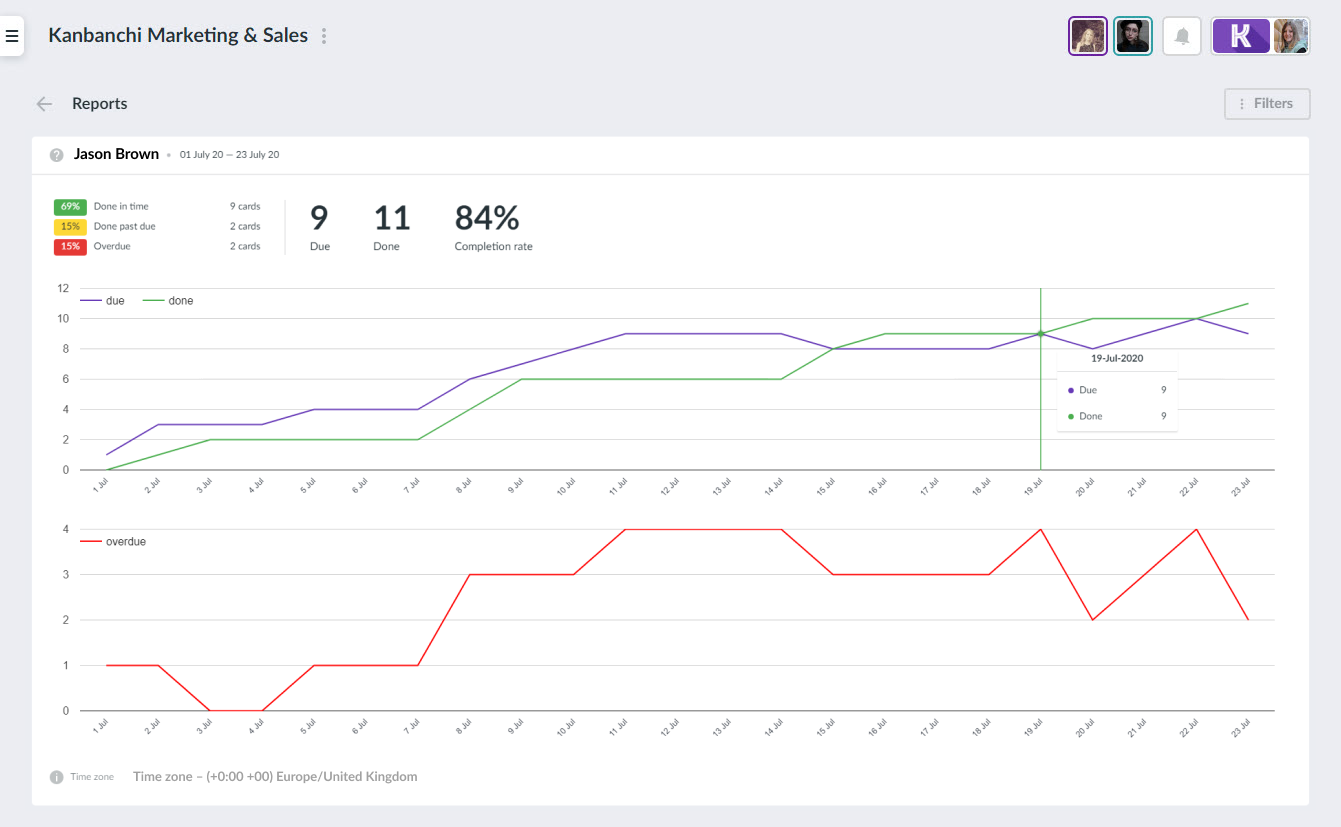
First of all, we think, you will pay attention to the completion rate. It shows how many tasks of all due tasks were completed during the specified period. Now, let’s talk about how we get that number. On the chart, you can see several types of data: the cards that are done in time, past due and cards that aren’t done and therefore are overdue.
Done in time means that they were completed on or before their due date during the specified period.
Done past due means that they were completed after their due date during the specified period.
Overdue means that their due date came during the specified period and they weren’t completed during the specified period.
Due means that their due date is within the specified period.
Your nifty chart displays your due in comparison with completed tasks. You can also see a separate graph with overdue tasks. It shows how many tasks were overdue on a certain date.
With the help of these visuals, you have the opportunity to quickly identify peaks and valleys of under control team’s performance. This allows you to find out areas of improvement faster, make the necessary changes in your team’s task, and accurately gauge project timelines.
Pretty awesome, right? What else do you need to be a successful leader?
That’s what you need! All the leaders of a team would like to know how every member of their team is doing. Using the Team Performance Chart in Kanbanchi you can easily see it in individual performance reports.
A snapshot of every team member’s progress contains completed, overdue, and of course, incomplete task reports. Taking it into account you can set realistic goals for your team and address issues faster.
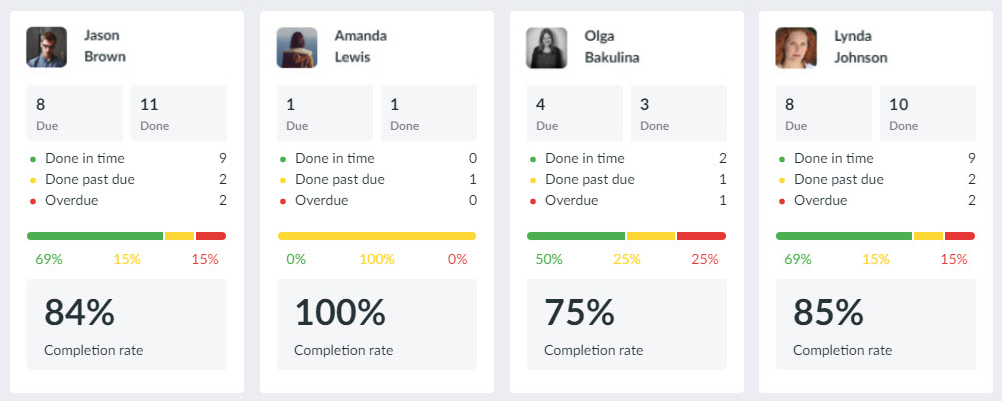
If you want more details on a definite person just click on the team member you need. You will be directed to a new page where you could see each of their overdue tasks, tasks completed after the due date, and completed tasks (within your chosen report date range).
With these graphs, you have a better understanding of every team member’s workload and might easily and timely decide if adjustments are needed.
And the best thing about Team Performance Chart is that you get all this information in one report. Sure you know that you can’t make better what you don’t measure. This also applies to your team’s productivity. But now you needn’t wasting time looking through your calendar for updates! So you can just focus on supporting your team instead. Which might make you the best team leader, ever.
Check out previous releases:
Team Workload view
New navigation panel
Subscription management


Start using Kanbanchi now
Start your free trial