Try Kanbanchi now
Start your free trial


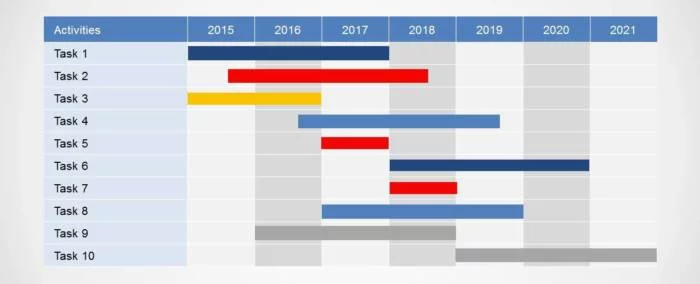
A Gantt chart doesn’t have to be complicated. In fact, it should be easy to work with it. Even a complex project or series of tasks can be made far more manageable in this way. This is a way of clearly laying out the timeline and tasks that make up a project. For decades, a simple Gantt chart has been invaluable to project managers and anyone else who needs to plan tasks.
Given that the idea is to make the project as easy as possible, what is your best option for getting a clear, informative plan that isn’t difficult and time-consuming to create or update?
There are some excellent reasons why project teams use Gantt charts for close to a century. Perhaps the most powerful motive is that it keeps life simple for everyone who is involved in the piece of work.
Anyone can see at a glance what tasks come next and when they are due to be completed. This means that a new team member can be brought up to speed on even a long, complex project in a matter of minutes.
Most people intuitively understand a simple Gantt chart when they see one for the first time. There is no need for extensive training courses or for a mentor to walk them through it.
Additionally, the fact that this is so easy to set up means that there is no excuse for not doing it. No matter how rushed a project is, the small amount of time taken to produce a good Gantt chart is always worth it.
This remains one of the very best ways of breaking down complex projects into simple to understand tasks.
We have already seen that Gantt charts are used to make life simple on complex projects. The fact that this sort of plan can be set up and altered so easily provides a few additional benefits that are worth taking into account.
The earliest Gantt charts were made by just writing down a series of tasks on a piece of paper in order. This simple approach proved to be very effective. Of course, it is still possible to create a Gantt chart by hand on a sheet of paper if you want to. You can get a serviceable plan drawn up in a matter of minutes in this way.
However, it seems fair to say that most people would only consider doing this for a very short and straightforward plan these days. After all, a hand-written plan is hard to share and could get very messy after you update it several times.
Instead, computers offer us a far more effective and modern approach to doing this. For example, if you want to create a basic, simple Gantt chart, then you can now do so very easily using Excel.
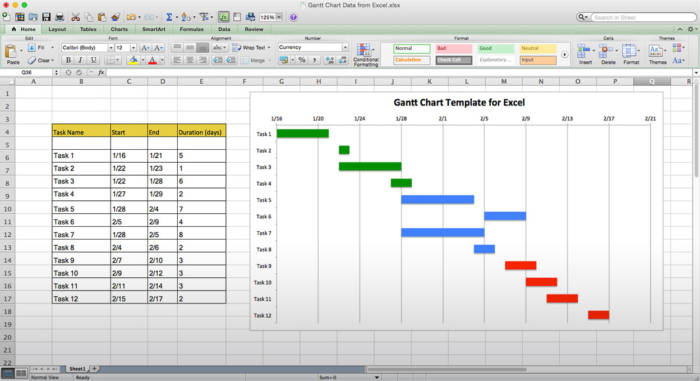
You don’t have to be an Excel expert to do this, as it is very easy to set up a Gantt chart using this program. This has the advantages of being very easy to amend and also easy to share online. It is also possible to use PowerPoint to do this if you prefer.
However, a very basic Gantt chart like this might not always be what you need. What about those occasions when your project demands a more comprehensive approach?
The truth is that even a well-designed Excel Gantt chart can come up short. If you need a highly polished and professional plan, then you may need to look a bit further.
Thankfully, you can get a far more effective chart by using Kanbanchi.
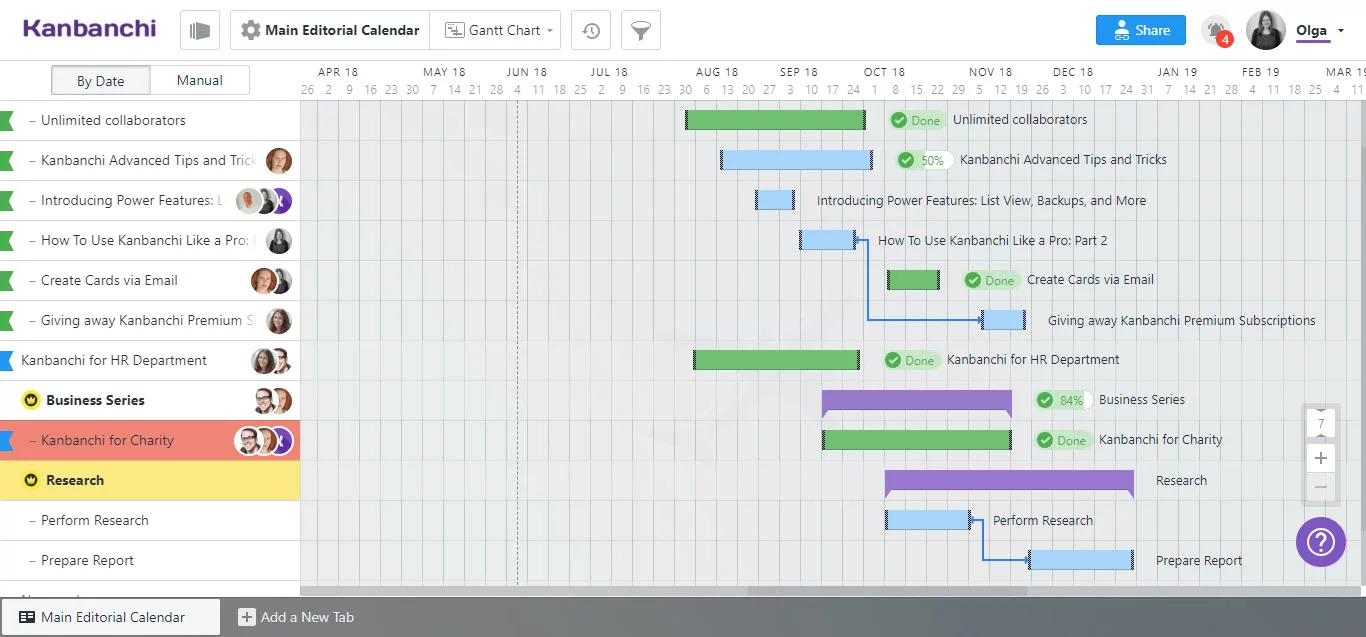
The app lets you create a visually attractive and effective Gantt chart that gives you a wide range of benefits.
Take a look at the benefits that you can gain from using Kanbanchi to make your projects better from now on. Run the app and get a free trial of all Enterprise plan features.
Read more: How Can a Gantt Chart Tool Help You with Your Projects?


Start using Kanbanchi now
Start your free trial