 Kanbanchi
Cycle time vs lead time: what I actually track on our kanban board
I run my team's work on a kanban board, and for a long time I used cycle time vs lead time as if they meant the same thing. They don't. Lead time is how long someone waits from asking for something to getting it. Cycle time is how long it takes once we actually start. The gap between the two is mostly waiting, and that's where I found the easiest wins.
Cycle time vs lead time in one minute
Both metrics measure elapsed time for one card, usually in days. Neither one is "how many hours did someone work on it". That's effort, and it's a different number (more on that below). And whichever order you say it in, lead time vs cycle time comes down to one question: when does the clock start?
What is lead time?
Lead time starts when the request lands on your board (the card is created) and stops when the card is done. It includes all the boring bits: sitting in the backlog, waiting for a decision, waiting for someone to be free. The person who asked only ever sees this number. They don't care that the actual work took two days if they waited two weeks.
What is cycle time?
Cycle time starts when someone pulls the card into progress and stops when it's done. The Kanban Guide defines it as the elapsed time between when a work item started and when it finished, and leaves it to each team to decide what "started" and "finished" mean. So decide, and write it down. On my board, started means "moved into In progress", and finished means "moved to Done".
Landed here from a factory article? In manufacturing, "cycle time" often means the time to produce one unit at one station, and takt time is the pace customer demand requires. On a kanban board for knowledge work, cycle time means start-to-finish for one card. Same words, different job.
| Lead time | Cycle time | |
|---|---|---|
| Clock starts | The card is created (request arrives) | Work starts (card enters In progress) |
| Clock stops | The card is done | The card is done |
| Waiting before work starts | Included | Not included |
| Waiting during work (review, approvals) | Included | Included |
| Who feels it | Requesters, stakeholders, customers | The team doing the work |
| Formula | Done date − Created date | Done date − Started date |
| Best for | Honest answers to "when will I get it?" | Spotting stuck work and planning |
| Mostly driven by | Queue size, priorities, intake | Work in progress, card size, blockers, hand-offs |
Try it: watch card aging on a real Kanbanchi board
This is a copy of a real Kanbanchi board, EcoWorld Website Launch, with its own lists, cards, colour labels and Card aging turned on. The small timer before each title is the card's age: how long it has sat in its list, or how long nobody has changed it. Drag a card to another list, or use its ⋮ menu, and watch the timer start over. When a card reaches Closure, the box below the board works out its lead time and cycle time. Time runs fast here: one second is one day.
- Marketing
3wkMarketing campaign launch
2wkOfficial website launch
1wkReview and approve designs
6dCode website features and functionality
3dFinal adjustments
2wkDevelop project plan and timeline
C1wkKickoff meeting with stakeholders
- ContentDesign
5dIntegrate design and content
- Development
3dConduct thorough testing
H
1wkDefine project objectives, scope
H6dRequirements gathering
C4dDevelop content strategy
H2dIntegrate content into the website
- Content
502wkContent creation and integration
2C - Content
1wkDevelop engaging content
H 921wkDesign wireframes and prototypes
2 / 3M- Development
3wkDevelopment phase
- Design
1moDesign phase
4dIdentify and fix bugs
2dSoft launch for internal review
331dPost-launch support and maintenance
#post-launch
1 / 3
3dFinal project review
- YellowDesign
6dFinal presentation and report
#analytics
L
A static snapshot of the board, showing time in the list. Turn on JavaScript to move the cards and run the clock.
What just happened
Try this: drag a card from To Do into Initiation. Its time in the list starts over at 0hr. Then switch Card aging to Show time without changes, or turn on Opacity to fade the cards nobody has touched for a week or more.
Finished cards in Closure (2): average lead time 23.5 d, average cycle time 14.5 d, waiting share 38%.
How to read the board
- Show time in the list is the card's WIP age in its current step. A card that has spent three weeks in Execution while the others pass through in days is the one to ask about.
- Show time without changes counts from the last edit or move. A card can sit in the right list and still be stuck: nobody has touched it, and every idle day goes straight into its cycle time.
- Any move starts both timers over. Moving a card within its list counts as a change, so only time without changes starts over.
- The demo also keeps two dates for each card: when it entered To Do and when it left To Do. When a card reaches Closure, lead time is counted from the first and cycle time from the second, and the difference is how long it waited before anyone started.
Lists, cards, colour labels, progress, checklists and subcards come from a real Kanbanchi board backup. Assignees are shown as initials only. Card ages are scaled down to days so you can watch them change, and start and due dates are counted from today.
A worked example from a kanban board
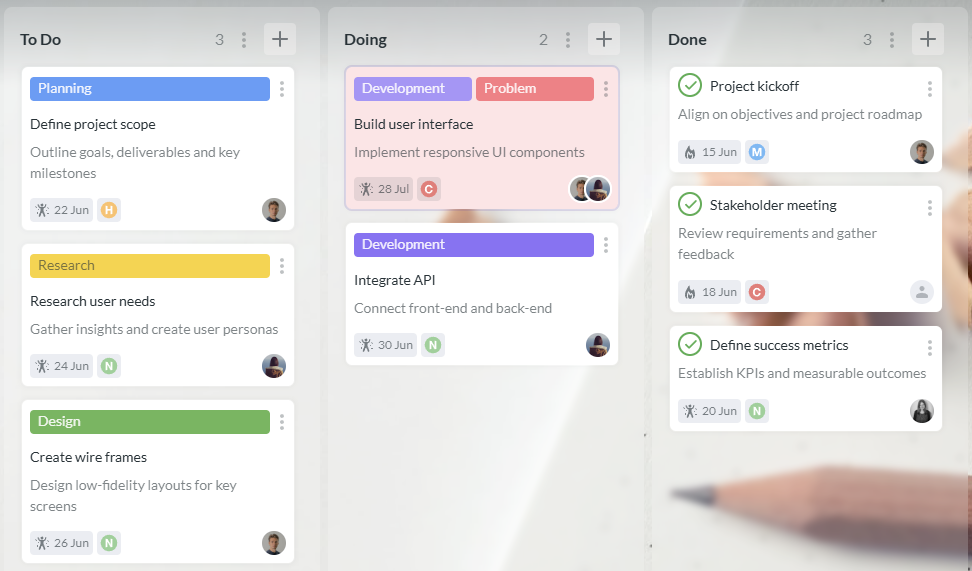
Here's a simplified week and a half from a board like the one I run. Five cards, three dates each. It's an illustrative example, rounded to whole calendar days, but the pattern is one I see all the time.
| Card | Created | Started | Done | Lead time | Cycle time | Waiting |
|---|---|---|---|---|---|---|
| Onboarding email refresh | Mon 2 Mar | Mon 9 Mar | Thu 12 Mar | 10 d | 3 d | 7 d |
| Fix broken signup link | Tue 3 Mar | Tue 3 Mar | Wed 4 Mar | 1 d | 1 d | 0 d |
| Customer survey | Mon 2 Mar | Thu 5 Mar | Mon 16 Mar | 14 d | 11 d | 3 d |
| Help-center article | Wed 4 Mar | Mon 16 Mar | Thu 19 Mar | 15 d | 3 d | 12 d |
| Team roles doc | Thu 5 Mar | Tue 10 Mar | Fri 13 Mar | 8 d | 3 d | 5 d |
| Average | 9.6 d | 4.2 d | 5.4 d | |||
| Median | 10 d | 3 d | 5 d |
What I read from this table:
- Average lead time is 9.6 days, average cycle time is 4.2. Out of 48 card-days of lead time, 27 were spent waiting before anyone started. That's a waiting share of 56%.
- Most cards take about 3 days once someone starts them (the median). That's a healthy, predictable core.
- The customer survey is the outlier: 11 days in progress. That isn't a speed problem. It's a stuck card, and it drags the average cycle time up from 3 to 4.2.
- The help-center article waited 12 days before anyone picked it up. That's a priority or capacity question, not a "work harder" question.
If I only tracked cycle time, I'd think we were fast. If I only tracked lead time, I'd blame the team. With both, I know the first fix is the queue.
 View full size
How to calculate cycle time and lead time from card dates
You don't need a special tool to start. You need three dates per card and an agreement on what they mean. Here's how I do it.
Agree on the three timestamps
Created is when the card appears on the board. Started is when it moves into the first "doing" list, not when it gets planned or assigned. Done is when it reaches Done. I put these rules in the board description so nobody has to guess.
Capture the dates on the card
In Kanbanchi, the card details show who created a card and when. You can give a card a start date, and you can filter cards by the date they were done, which is handy for "everything we finished last week".
View full size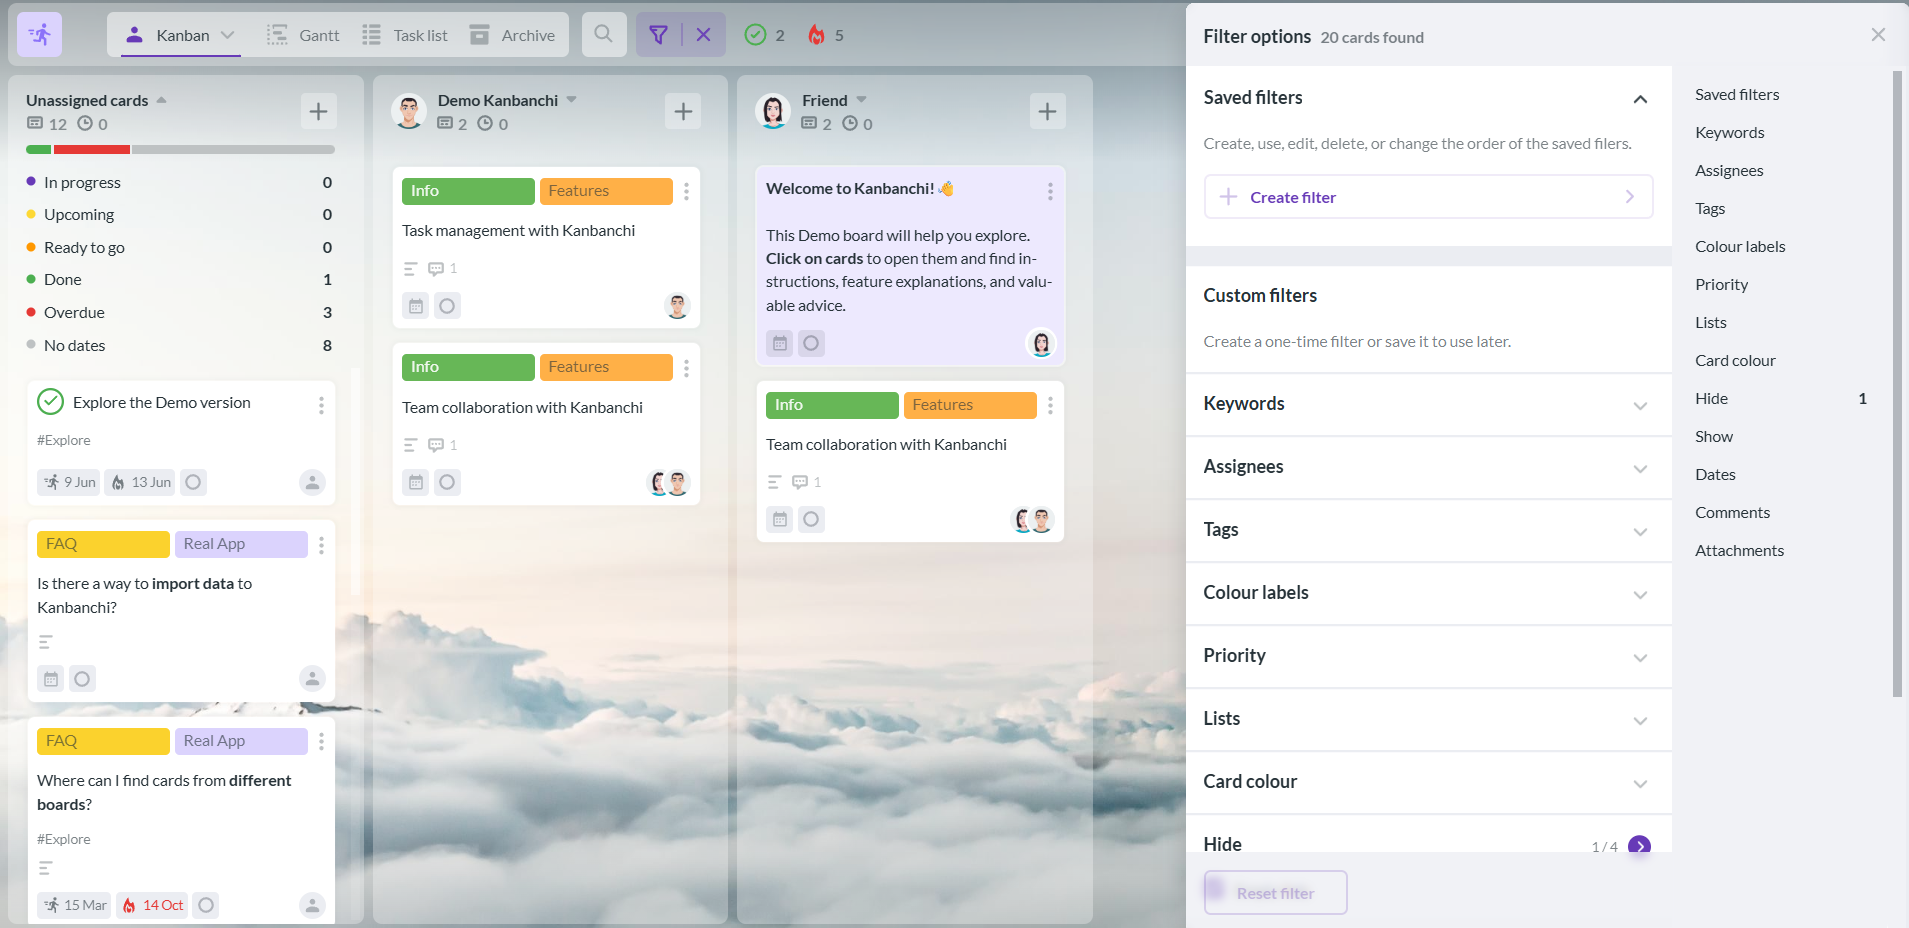
The filter panel in Kanbanchi. Filtering by done date lives under Dates. One trap: Kanbanchi has a board setting that sets the creation date as the start date automatically. It's useful for planning, but if it's on, your start date equals your created date and cycle time will look exactly like lead time. For cycle time, I set the start date when the card is really pulled into progress.
Pull the numbers into a sheet
Kanbanchi can export board data to Google Sheets. With created in column B, started in C and done in D, these are the only formulas I use:
Lead time       =D2-B2
Cycle time      =D2-C2
Waiting         =C2-B2
Waiting share   =(C2-B2)/(D2-B2)
Working days    =NETWORKDAYS(C2,D2)-NETWORKDAYS(C2,C2)
Format the first three columns as numbers, not dates, or Sheets will show you something like "10/01/1900". The working-days formula counts Monday to Friday after the start date, the same way the calculator below does, so a card started on Friday and done on Monday is 1 working day.
Look at the median, not just the average
One stuck card wrecks an average. In the example, the median cycle time is 3 days and the average is 4.2, all because of one card. Once you have 20 or more finished cards, look at the 85th percentile too. "Most of our cards are done within 6 days" is a promise you can keep. An average isn't.
Pick calendar days or working days and stick to it
Calendar days are what requesters feel. Working days are fairer when you compare a normal week with a holiday week. Either is fine. Mixing them is not.
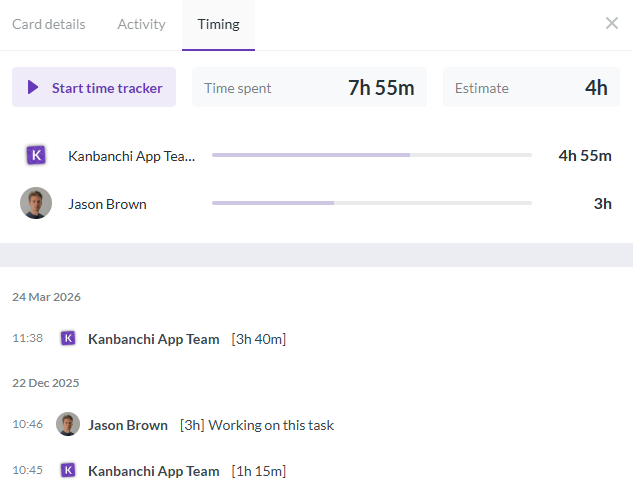
Cycle time isn't time tracking. Kanbanchi's time tracker logs the hours someone actually spent on a task. A card can have two hours logged and a nine-day cycle time. The difference is waiting inside your process: reviews, approvals, someone being out. Both numbers are useful, for different questions. There is more on effort in project time estimation vs reality.
 View full size
Cycle time and lead time calculator
Enter created, started and done dates for a few cards. The calculator works out lead time, cycle time and how much of the wait happened before anyone started. Leave Done empty for a card that's still in progress, and you'll see how old it is instead. It's loaded with the example above, so just type over it.
All numbers are in calendar days (d).
Add dates to see what they say.
Little's Law links three averages: average cycle time = average work in progress ÷ average throughput. Use it to see what happens to cycle time when you start fewer things at once.
Little's Law works on long-run averages for a fairly stable board. It's a sanity check, not a forecast for one card.
Want the dates on your cards to do this work for you?
Kanbanchi is a kanban board that lives in Google Workspace, with start dates, done dates and export to Google Sheets.
Throughput, WIP age and Little's Law: the only bits I use
There are plenty of other kanban metrics. These three are the ones that earn their place next to cycle time and lead time.
Throughput
Cards finished per week. I watch the trend rather than set a target, because a target just encourages tiny cards. Kanbanchi's burn up chart shows completed cards against the total scope over time, and the burn down chart shows the work that's left.
WIP age
How long a card has been in progress so far: today minus its start date. Think of it as cycle time for cards that aren't finished yet. It's the earliest warning you get, because you don't have to wait for a card to finish to know it's in trouble. The calculator above shows it for any card without a done date. In Kanbanchi, the Card aging setting puts a version of this on the cards themselves: a small timer with each card's time in the list or time without changes, and an option to fade cards that haven't moved for a week or more.
Little's Law
Average cycle time ≈ average WIP ÷ average throughput. With 6 cards in progress and 5 finished a week, that's 1.2 weeks, or about 8.4 days. Cut WIP to 3 with the same throughput and you'd expect about 4.2 days. It only holds for averages over a fairly stable period, but it's the clearest argument I know for WIP limits. The Little's Law tab in the calculator above runs the same sum on your own numbers.
Fun fact: the Kanban Guide's four flow metrics are WIP, throughput, work item age and cycle time. Lead time isn't on the list. I still track it, because it's the number my stakeholders ask about.
Which number answers which question? A 30-second decision guide
When someone pings me about "the metrics", I run through these three questions before I open the board. Click your answers and it tells you which number to pull.
Is someone asking "when will I get it?"
No: go to question 2Yes: lead time
Quote the median lead time, plus the 85th percentile if they need a promise. It's the only number that includes the wait before anyone picks the card up.
Work it out in the calculatorDo you want to know if the team got faster at the work itself?
No: go to question 3Yes: cycle time
Compare this month's median with last month's. One slow card shouldn't ruin the comparison; that's what the median is for.
See the median in the calculatorIs something stuck right now?
Yes: WIP age
Look at the oldest card in progress. Cycle time only shows up once a card is done, so it's too late for this question.
What WIP age isNo: throughput
If you're planning how much fits into the next few weeks, count finished cards per week and plan with that.
Throughput and Little's Law
What slow flow looks like on a board
"We're slow" isn't something you can fix. These four patterns are. I check for them every week, and they usually show up on the board before they show up in complaints.
A long queue before "In progress"
Waiting share above half. Cards created weeks ago that nobody has touched. People chasing you for updates on things that haven't started.
Cards aging in progress
A card sits in the same list for days with no edits. Kanbanchi's card aging tracks how long a card stays in a list or goes without changes, and fades inactive cards. You can set it per list.
Everything is "in progress"
More cards started than people to work on them. Everyone is busy, lots of context switching, and cycle time creeps up anyway. That's Little's Law in real life.
Cycle times all over the place
One card takes a day, the next takes eleven. Nobody can promise a date. Usually the cards are very different sizes, or work waits on someone outside the team.
What I do about slow flow
Each pattern has a different fix. This is the cheat sheet I actually use, starting with whatever the numbers point at.
| What I see | What I try first |
|---|---|
| High waiting share | Triage the backlog weekly: every old card gets a date, a "not now" or the archive. Only pull new work when someone is free. Quote requesters the median lead time, not the best case. |
| Old cards in progress | Start the stand-up with the oldest card: "what would it take to finish this today?" Swarm on it, or split it so part of it can ship. |
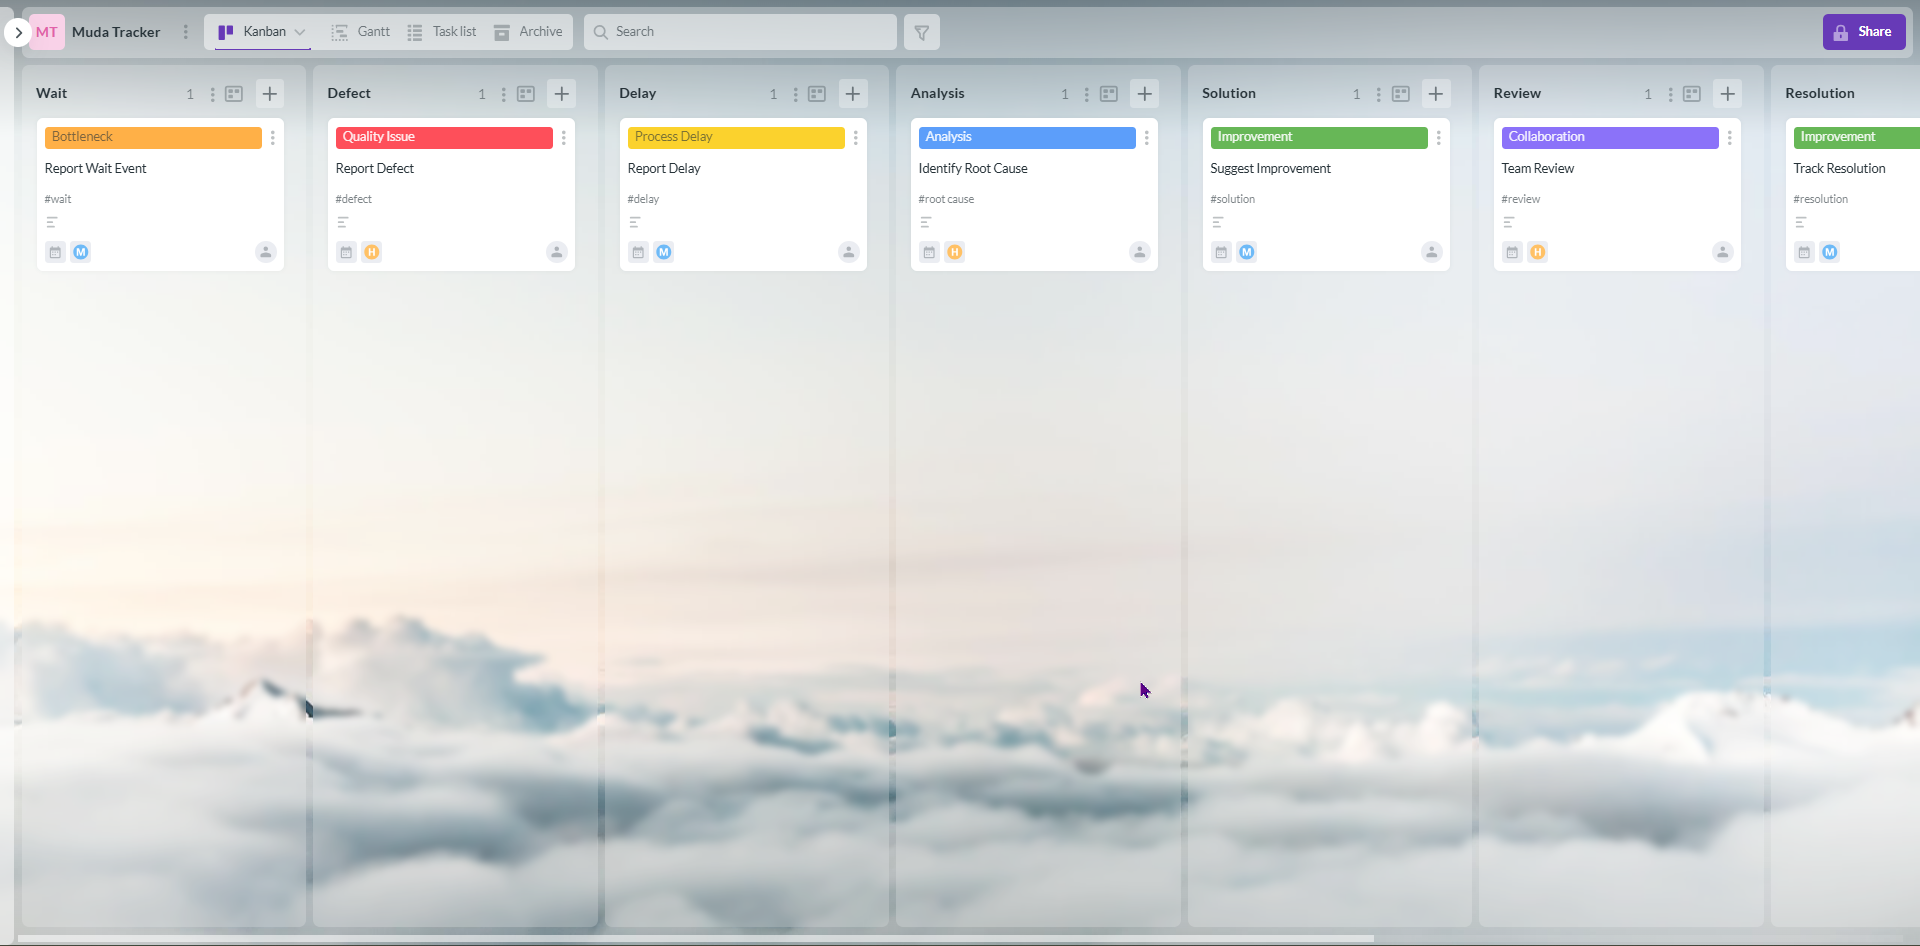
| Too much work in progress | Put a limit on the In progress list. In Kanbanchi you can limit the card number in a list, and the counter turns red when you go over. Stop starting, start finishing. |
| Unpredictable cycle times | Split big cards so most fit into a few days. Give "waiting for approval" its own list so the wait shows up on the board instead of hiding inside In progress. |
| Review or approval pile-up | Limit that list too, and make reviewing a card more important than starting a new one. |
What I don't do any more: ask people to work faster. In the example, cycle time was fine. The waiting wasn't in their hands, it was in mine. If WIP limits are new to you, Task board vs Kanban: is it all about WIP? is a good primer.
What changed once I tracked both
- Stand-ups got shorter. We go through the board from the oldest card, not person by person. "Who's blocked?" answers itself.
- I stopped promising dates from gut feeling. I quote what our own history says: the usual lead time and the slow-but-normal case.
- Stakeholder conversations got calmer. "Why is this taking so long?" became "this waited 12 days before we started. Do you want it ahead of the survey?" That's a priority call, and it belongs to them.
- The backlog shrank. Once you see how long cards wait, "someday" cards are much easier to archive.
Mistakes I made so you don't have to
- Starting the clock when a card was planned or assigned, instead of when work actually began.
- Reporting only the average, so one stuck card made the whole month look bad.
- Comparing cycle times between teams. Different card sizes and different definitions of "done" make it meaningless.
- Turning cycle time into a target. People start closing cards early or splitting them just to look fast. Use it to find problems, not to grade people.
- Losing reopened cards. If a card comes back from Done, keep its original created and started dates and use the final done date.
New to running work this way? Start with what a kanban board is and how to build a kanban system in 10 steps, then come back to the numbers.
What it costs to track this on a Kanbanchi board
Everything above runs on card dates: when a card was created, when work started and when it was done. What I actually need for the method in this article is board export to Google Sheets, where the formulas live, and the activity feed, so I can check when a card really moved. On Kanbanchi's compare table both start on Premium. The time tracker (that's effort, not cycle time) and the Gantt chart come with Professional.
Move the slider to your team size, from just you to a whole department, and tick what you need. The highlighted plan is the cheapest one that has all of it.
What you need
Discount
You apply for it with Kanbanchi's form; it isn't applied automatically.
The free trial runs on the Enterprise plan, so you can try everything before you choose.
Cycle time vs lead time: FAQ
Is cycle time part of lead time?
Yes. Cycle time is the last part of lead time, from the moment work starts until it's done. Lead time adds the waiting before work starts. So lead time is always equal to or longer than cycle time.
Which matters more, lead time or cycle time?
Depends on who's asking. Lead time matters most to the people waiting for the work. Cycle time matters most to the team, because it's the part they can change directly. I track both because the difference between them tells me where to look.
What is the cycle time formula?
For one card: cycle time = done date − start date. For a whole board on average, Little's Law gives you cycle time = average WIP ÷ average throughput. Lead time is done date − created date.
Can cycle time be longer than lead time?
No. If your numbers say it is, a date is wrong. Usually the start date was set before the card existed, or a reopened card got a new created date. Check those first.
Should weekends count?
Your call. Calendar days match what requesters experience. Working days make weeks with holidays easier to compare. Pick one for the whole board and say which one you're using when you share the numbers.
What's a good cycle time?
There's no universal number. A content team and a hardware team will never match, and that's fine. Compare your board with its own history. "Good" means cycle times are fairly predictable and the outliers are getting rarer.
How is takt time different from cycle time?
Takt time is a manufacturing term: available production time divided by customer demand, so it's the pace you need to keep. Cycle time is how long the work actually takes. On a kanban board for knowledge work, you'll rarely need takt time.
What is WIP age, and how is it different from cycle time?
WIP age (or work item age) is how long an unfinished card has been in progress so far. Cycle time is only known once the card is done. Age is the early warning, cycle time is the result.
Can I see cycle time and lead time in Kanbanchi?
I work them out from card dates. Kanbanchi shows when a card was created, lets you set start dates, filter cards by done date and export board data to Google Sheets, where the formulas above do the rest. Card aging and the burn up and burn down charts cover "is anything stuck?" and "how much are we finishing?".
Put your card dates to work
Start dates, done dates, card aging, list limits and reports on a kanban board inside Google Workspace.
Keep reading