In this Article:
Try Kanbanchi now
Start your free trial


Project management is not an easy thing. You are constantly torn between projects, multiple tasks, people, and competing priorities. Miss one deadline and the whole plan can go sideways. Sometimes with serious consequences. That is exactly why a Gantt chart application exists: to give you and your team a clear, shared view of what needs to happen and when.
Today, people from all walks of life, not just project managers, use Gantt charts to plan, organize, and deliver. Business teams, educators, creative teams, and startup founders all benefit from them. This guide explains what a Gantt chart application is, why teams lose control without one, and how to use it to keep your projects on track.
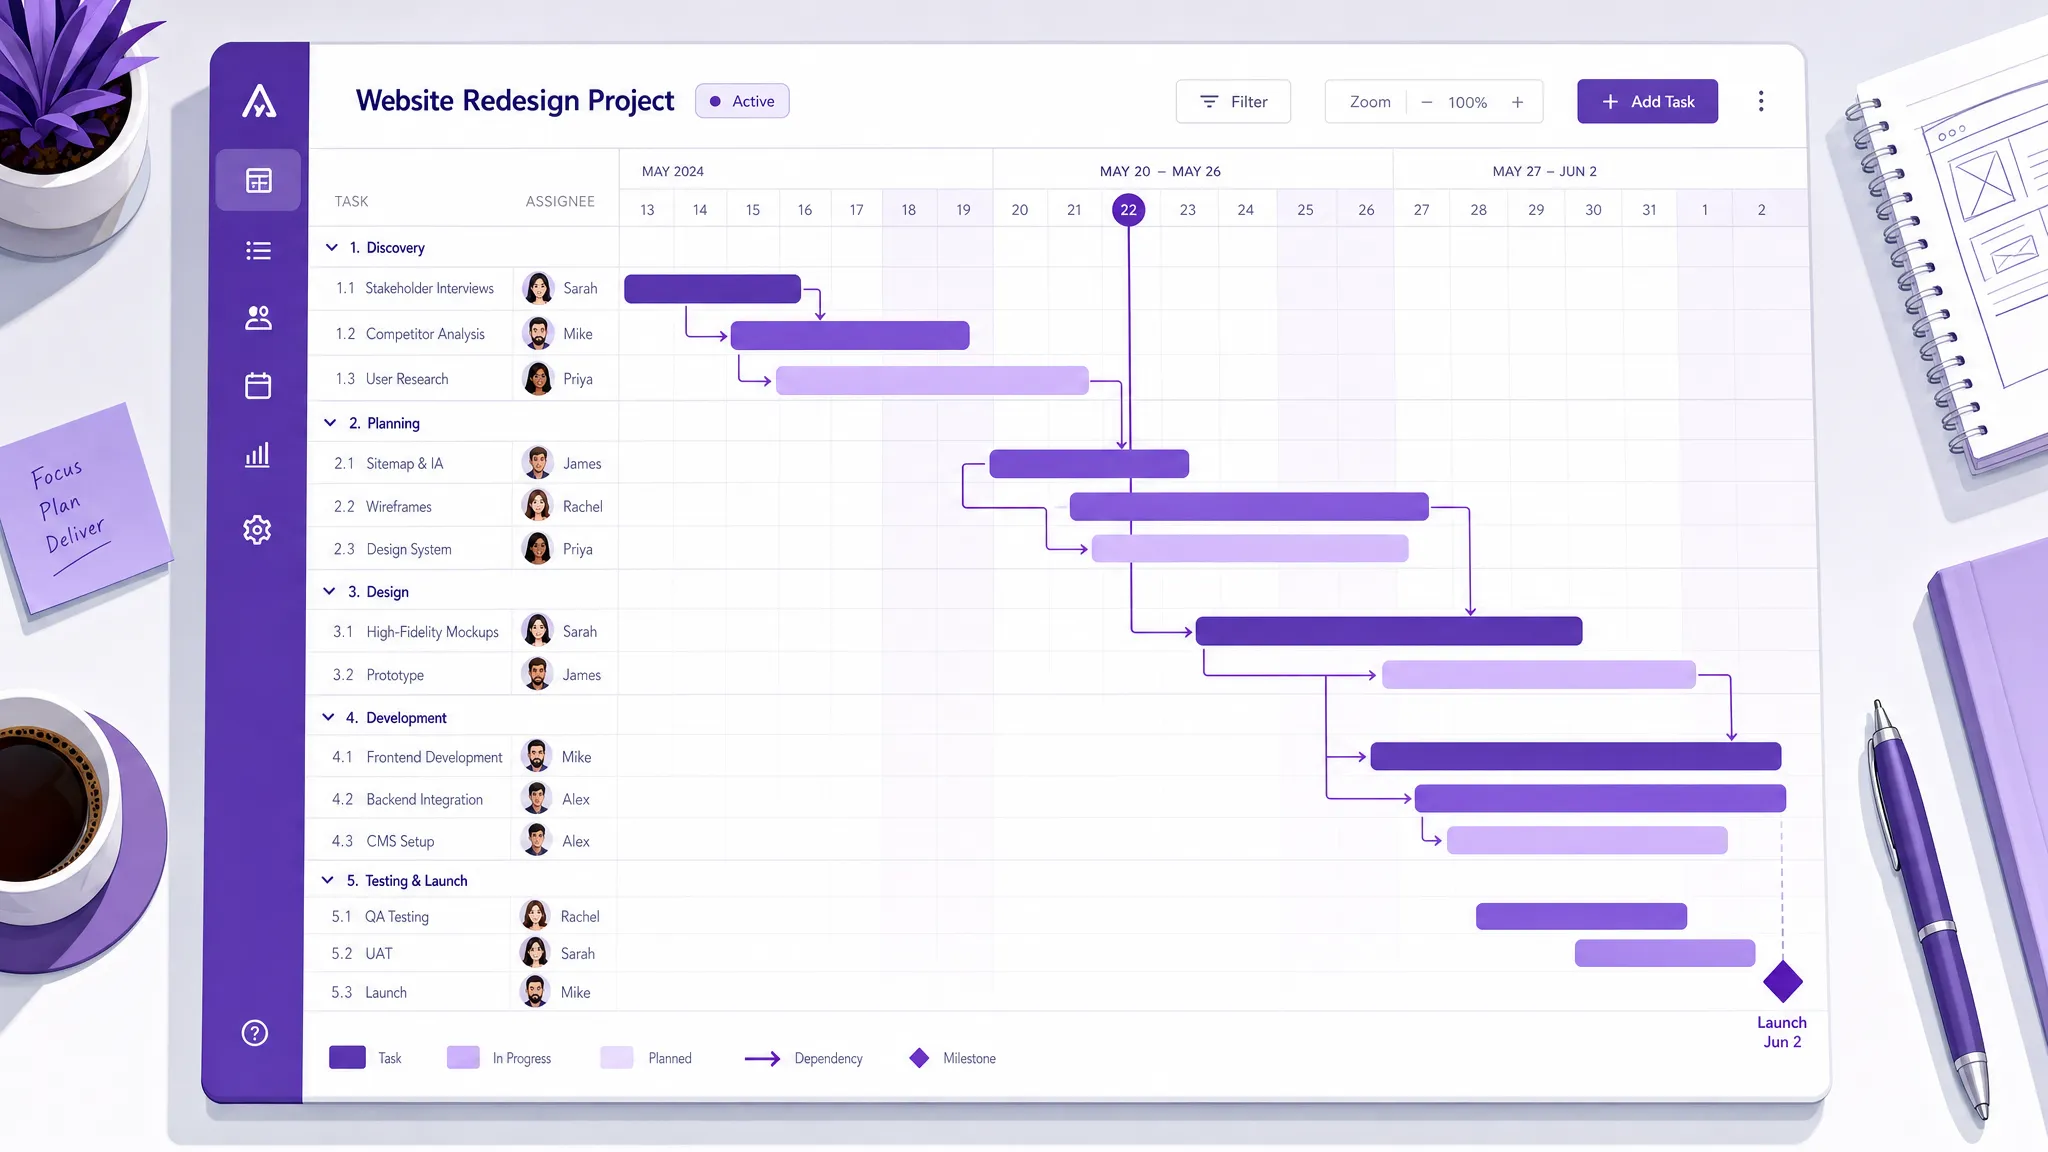
A Gantt chart is a visual project timeline: tasks displayed as horizontal bars across dates, showing what starts when, how long it runs, and how activities relate to each other. A Gantt chart application turns that static concept into a live tool: teams can update tasks, shift dates, connect dependencies, and track progress in real time rather than redrawing a plan every time something changes.
At a glance, a well-composed Gantt chart tells you:
That is why Gantt charts are such reliable allies for planning, scheduling, and managing projects. They turn a complex set of tasks into something a whole team can understand in seconds.
A modern Gantt chart application goes further than a static chart. It lets teams update tasks, adjust dates, connect related work, and collaborate around the plan in real time. Instead of creating a schedule once and managing the real project somewhere else entirely, teams use the application as an active control center.
The origin of the idea dates back to the mid-1890s, when Polish engineer Karol Adamiecki invented a diagram he called a harmonograph. He created it to improve how production schedules were displayed, but his ideas were only published in Polish and Russian, which limited their reach.
Some fifteen years later, American engineer and project management consultant Henry Laurence Gantt worked on similar problems and designed his own version of the chart. His version became widely known in Western countries, and his name became permanently associated with charts of this type.
Originally, Gantt charts were made laboriously by hand. Every update could mean redrawing the entire chart, which significantly limited their usefulness, since change is a constant feature of most projects. With the development of software and dedicated Gantt chart applications, creating, updating, and sharing a chart became effortless.
A Gantt chart application turns a project plan into a living timeline. Instead of managing dates in isolation, team leaders can see tasks, owners, dependencies, milestones, and progress in one shared view. That makes it easier to spot schedule risks early, coordinate handoffs, and adjust work before delays become expensive.
A practical Gantt chart view usually includes task names, start and due dates, duration, ownership, dependencies, progress tracking, and milestones. These elements help leaders answer the essential control questions: What is planned? What is late? What comes next? Which task is blocking another?
The value is not only in the visualization. The value is in shared understanding. When everyone sees the same timeline, project discussions become more precise and less dependent on memory or assumptions.
A spreadsheet-based Gantt chart can be useful for a quick plan, especially when a project is small and owned by one person. But as soon as several people are responsible for different parts of the work, manual timelines become fragile. Dates change, dependencies shift, and the file quickly stops reflecting reality.
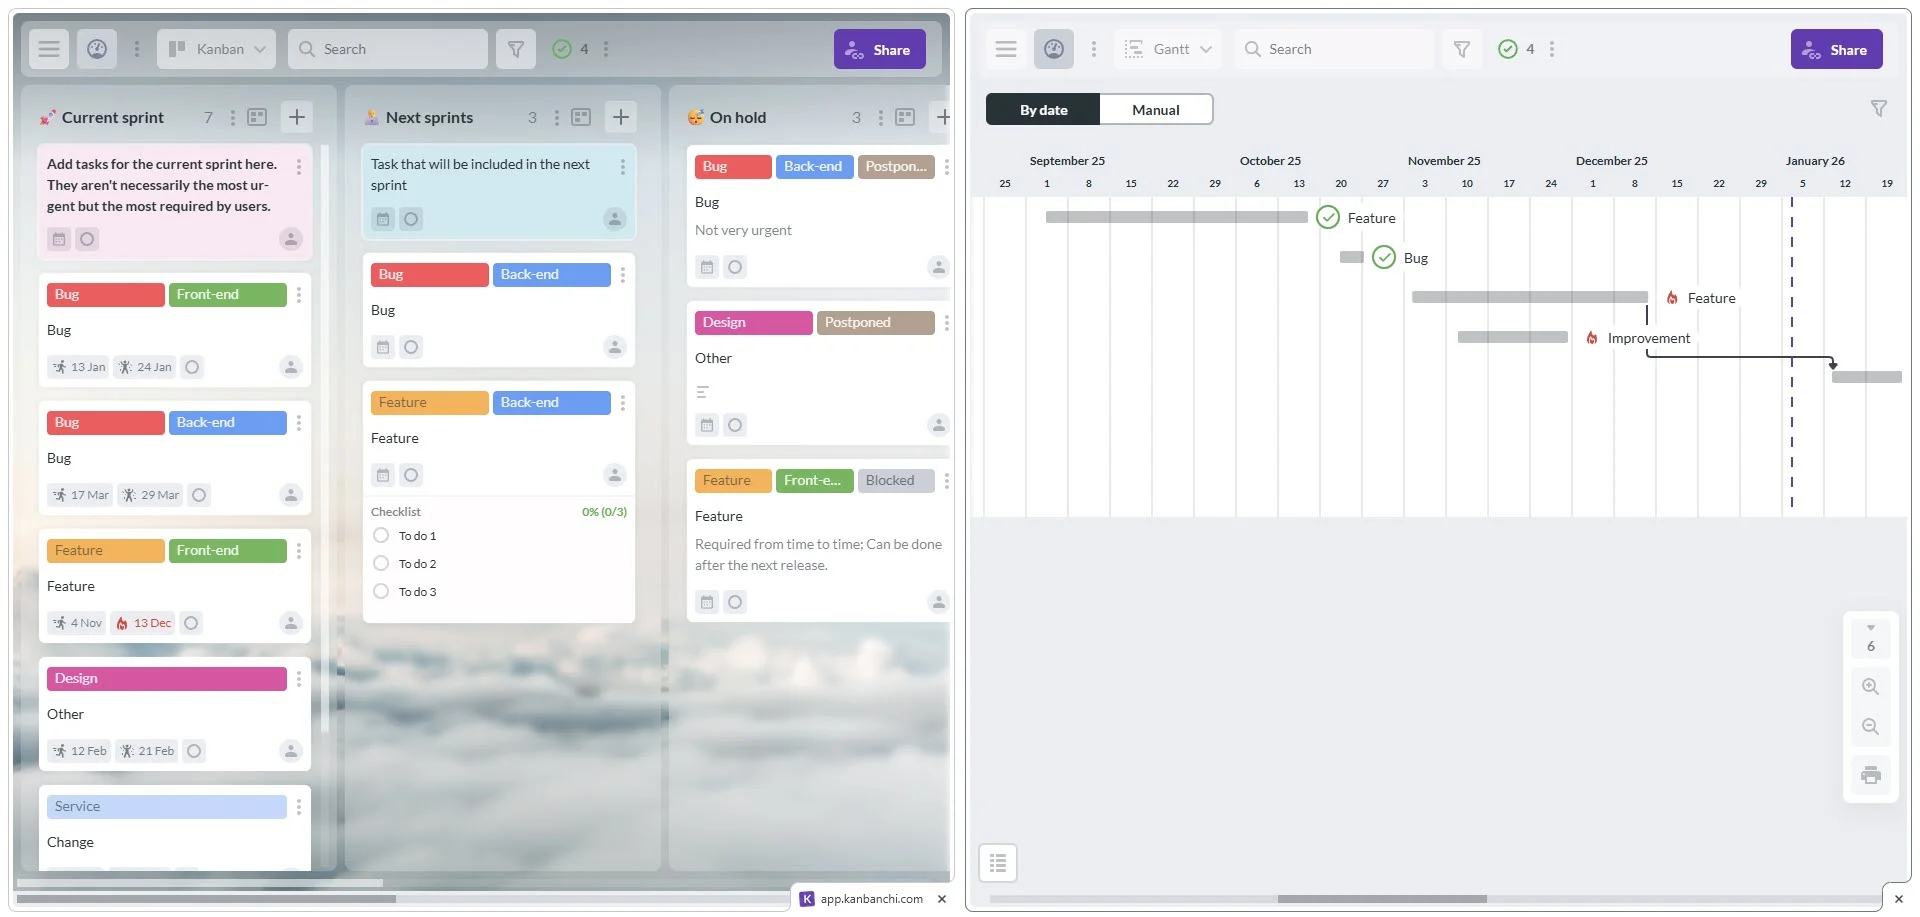
A dedicated application solves this by connecting the schedule with actual tasks. In Kanbanchi, for example, cards from a project board can be viewed as a Gantt Chart, giving teams both a workflow view and a timeline view of the same work. Check out the Gantt chart vs Kanban if you want to compare these two approaches in more detail.
As for additional functions such as Time Tracker, card Archive, and the ability to see cards from all boards, these help you stay in control of everything in one place, without jumping between tools.
Most projects do not fail because teams ignore the work. They lose control because the real status becomes difficult to see. A task may be waiting for approval, a file may be missing, or one department may not realize that another team needs its output before they can continue.
A due date alone does not explain the chain of work behind it. If Task B cannot start until Task A is complete, a delay in Task A affects the entire schedule. Without visible dependencies, team leads often discover this too late. A Gantt view makes those relationships clear: when a dependent task moves, the impact is immediately visible.
Many teams use email for requests, Drive or OneDrive for files, Calendar for meetings, and spreadsheets for status. Each tool has value, but project control becomes harder when no single place connects the work. This is especially common in Google Workspace and Microsoft 365 environments: teams have strong productivity suites, but still need a dedicated project management layer to turn conversations, documents, and deadlines into trackable work.
When leaders cannot see project status directly, meetings become a slow process of asking everyone for updates. A Gantt chart application gives managers a current picture before the meeting starts, so discussions can focus on decisions, blockers, and priorities, not basic status collection.
See your project timeline clearly from day one. Kanbanchi combines Kanban boards and Gantt charts in one tool, built for Google Workspace.
The general benefits of Gantt charts (clear timelines, dependency tracking, resource visibility, etc.) are well documented. “Gantt Charts Benefits: Help Drive Project Success” covers those in depth. What is worth focusing on here is something more specific: how a Gantt chart application shifts a team from reactive to in control.
Most project problems are not surprises. They are signals that went unread. A task sitting in “In Progress” for two weeks, a dependency nobody flagged, a phase that was always too compressed. A shared timeline makes those patterns visible before they become crises. Leaders stop discovering problems at the deadline and start catching them during the week.
When tasks have owners, dates, and visible connections, people know when their work matters to someone else. That changes behavior without any extra pressure from the manager. The system does the reminding, not you.
Every project changes. The difference between teams that handle change well and teams that scramble is whether the plan is maintained or abandoned. A live Gantt chart makes adjusting dates, shifting dependencies, and communicating changes a quick task rather than a full replanning session.
There are many Gantt chart apps available, so finding the right one can take time. The right tool depends on your team size, workflow, and technology stack, but teams that want stronger project control should look beyond basic timeline drawing. The application should help manage work, not just display it.
| Capability | Why it matters for project control | How Kanbanchi supports it |
|---|---|---|
| Timeline planning | Shows tasks across dates and phases | Kanbanchi turns project boards into a Gantt Chart |
| Task ownership | Clarifies who is responsible for work | Cards include assignments, dates, comments, and details |
| Dependencies | Helps teams understand handoffs and timing impact | Cards can be connected in time on the Gantt Chart |
| Workflow view | Shows execution status, not only the schedule | Kanban boards and List view support daily task management |
| File context | Keeps documents close to the task | Attach files from Google Drive, Shared Drives, OneDrive, and SharePoint |
| Calendar visibility | Helps people see important dates in their schedule | Kanbanchi can add events to Google Calendar |
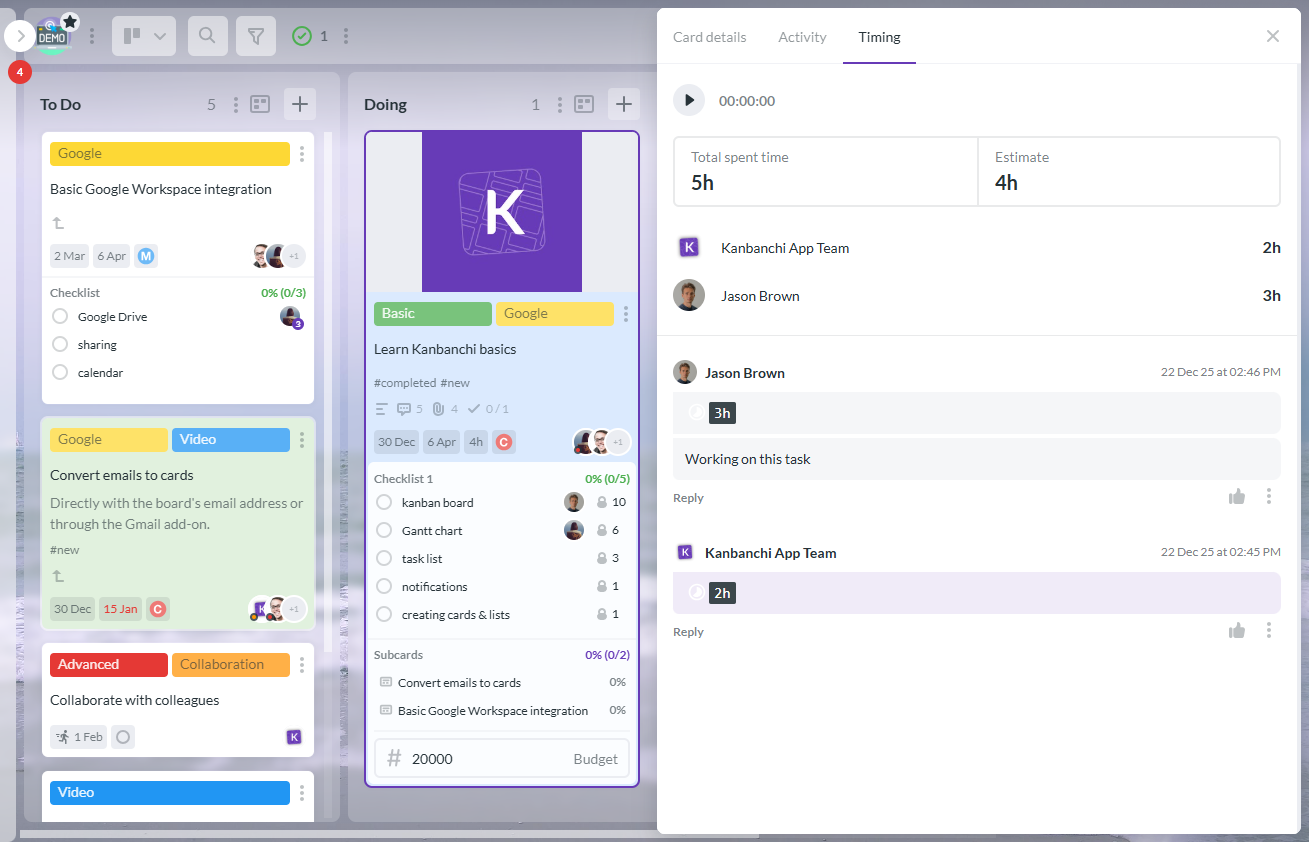
| Time tracking | Shows how effort is spent across tasks | Time Tracker records time directly on cards |
| Reporting and export | Helps leaders analyze and share progress | Export to Google Sheets or connect to Google Looker Studio |
| Security and governance | Supports company policies and enterprise needs | Works with Google Workspace sharing policies and enterprise-grade security |
A good test when evaluating tools: will this become part of how the team works every day, or will it become another place where managers maintain a plan manually? The more the Gantt chart is connected to real tasks, files, and collaboration, the more control it actually provides.
Kanbanchi is designed for teams that want visual project management inside the productivity ecosystem they already use. For Google Workspace users, that means deep integration with Google Drive, Shared Drives, Gmail, Google Calendar, and Google Sheets. For Microsoft 365 teams, Kanbanchi also supports work with OneDrive and SharePoint.
Kanbanchi starts with visual boards and cards. Teams create project boards, organize work into lists, assign people, set dates, and attach files. When timing becomes the main question, the same work can be viewed as a Gantt Chart without rebuilding the plan from scratch.
This is useful because most teams need both views. A Kanban board is excellent for managing workflow. A Gantt Chart is better for understanding how work unfolds over time. Kanbanchi lets teams use both without splitting the project across different tools.
A task is easier to complete when the brief, spreadsheet, design file, proposal, or contract is attached directly to it. Kanbanchi supports attachments from Google Drive and Shared Drives, keeping work connected to the files teams already use and reducing the time spent searching email threads for the right document.
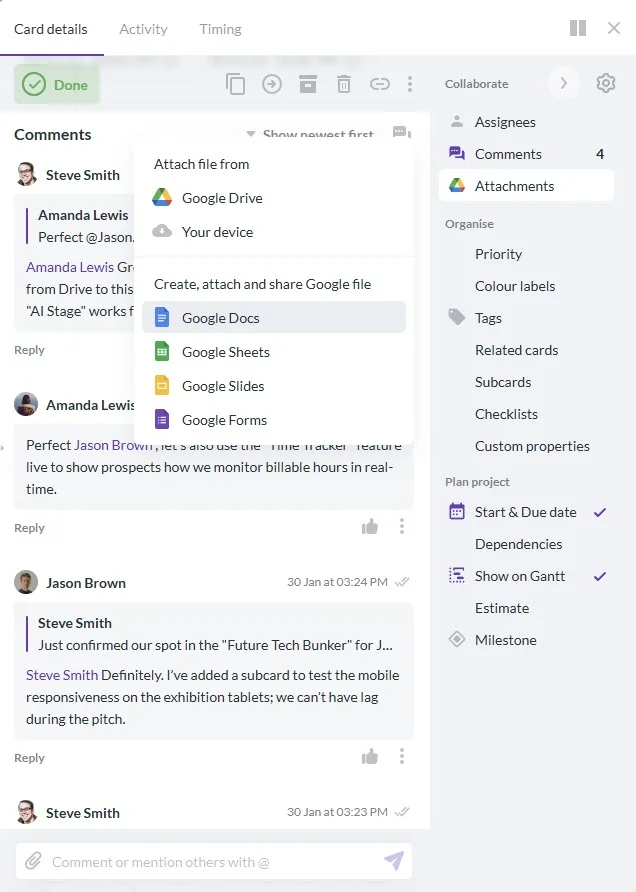
Many projects begin in email. A customer request, an approval note, or a vendor message can become work that needs to be tracked. Kanbanchi supports card creation from Gmail, so teams can turn important messages into actionable tasks. Dates can also be connected with Google Calendar, keeping project timing visible alongside everyday schedules.

Schedule control is only one part of project control. Leaders also need to understand effort. Kanbanchi’s Time Tracker lets users log time on cards, making it easier to review how much work is going into tasks and projects. For reporting, teams can export board data to Google Sheets or connect to dashboards like Google Looker Studio.
Sign up for a free Kanbanchi trial today
If a project already feels unclear, do not start by building a complex timeline. Start by making the work visible, then add timing and dependencies.
The goal is not to create a perfect plan. The goal is to create a plan that can be inspected and improved. Project control comes from routine visibility, not from one-time planning.
Most Gantt chart mistakes (overcomplicating the timeline, ignoring dependencies, forgetting to update it, etc.) are also covered thoroughly in “Gantt Charts Benefits: Help Drive Project Success“. There is one mistake worth adding here, as it is particularly common in teams new to shared timelines.
The Gantt chart should not be a private planning file that only the manager can see and update. When team members can view the timeline, they understand how their work connects to everything else. It reduces surprises, improves handoffs, and means the manager is not the only person watching the schedule. A chart nobody else looks at is just a more complicated to-do list.
Not every task needs a Gantt chart. A simple personal to-do list is often enough for individual work. But as team coordination grows, timeline visibility becomes increasingly important.
| Project situation | Why a Gantt view helps |
|---|---|
| Multiple people or departments involved | Shows handoffs and ownership across the team |
| Deadlines are fixed | Identifies which tasks threaten the final date |
| Work has dependencies | Makes clear what must happen before other tasks can start |
| Stakeholders need regular updates | Provides a visual way to explain progress and timing |
| Files and decisions are scattered | Connects task details, dates, and context in one place |
| Plans change often | Makes rescheduling faster and more transparent |
For growing teams, a Gantt chart application is often the point where project management becomes less reactive. Leaders stop relying on memory and status chasing and start managing from a shared source of truth.
A Gantt chart application is software that displays project tasks on a timeline. It helps teams plan dates, see task duration, understand dependencies, track progress, and adjust schedules as work changes. The term also refers to the practical application of Gantt charts to real project management, using them as an active control tool rather than a one-time planning exercise.
It improves control by making the project timeline visible to everyone. Leaders can see what is planned, what is running late, which tasks depend on others, and where schedule risks may appear. This supports faster decisions and clearer communication across the team.
Neither is universally better. A Gantt chart is best for time-based planning, dependencies, and milestones. A Kanban board is best for workflow visibility and day-to-day task movement. Many teams benefit from using both views together, which is exactly how Kanbanchi is designed.
Google Workspace does not provide a full native Gantt chart application for project management. Teams can create basic timelines in spreadsheets, but a dedicated tool like Kanbanchi adds connected Kanban boards, Gantt planning, Drive attachments, Calendar integration, and time tracking. All inside the Google Workspace ecosystem.
When the spreadsheet becomes hard to maintain, multiple people need to update it, dependencies matter, deadlines are changing, or leaders need a reliable view of project status without manual reporting, it is time to move to a dedicated application.
Read next: How to Introduce Simple Gantt Chart Software to a Project Team?
How do I create a nice Gantt chart?
A Gantt chart application gives project leaders the visibility they need to manage time, dependencies, and accountability with confidence. The biggest advantage comes when the chart is connected to the work your team is already doing, not living in a separate tool that nobody remembers to update.
Kanbanchi combines Kanban boards, Gantt Chart planning, Time Tracker, file attachments, calendar visibility, and reporting in a workspace built for Google Workspace and compatible with Microsoft 365. If your team needs clearer schedules and better project control, try Kanbanchi and turn your project plan into a timeline your team can actually use.
If you want to invest some more time into exploring options, our guide “The 10 Best Gantt Chart Software for Project Management” might be of interest to you.


In this Article:
Start using Kanbanchi now
Start your free trial