How do I create a nice Gantt chart?
To complete a project on time, you need to control a huge number of activities and make sure that they’re going to be completed as planned. Missing one deadline can delay the entire project and increase its cost. That’s why Gantt charts giving an opportunity to see what and when need to be done at a glance are so helpful.
A Gantt chart is a graphical display of your project’s schedule. It is a kind of bar chart showing start and due dates for all project elements and includes tasks, milestones, and dependencies. A properly created Gantt chart is sure to simplify any project planning process.
Let’s see how Kanbanchi can help you to create a nice Gantt chart and organize your projects.
Step 1: To create a proper chart first of all you need to think over the whole project and divide it into manageable tasks. Then set up a card for each task and assign the cards to your team members. Don’t forget to add Start and Due dates to each card and check the Show on Gantt option in the “actions” section.
Step 2: Now it is time to distinguish task relationships and distribute dependencies between the cards/tasks.
- You may make a card an Epic adding or creating Subcards. It will let you calculate the Epics progress.
- You can also link cards through a simple Finish-To-Start Dependency using our Dependencies feature. It will show that the first card needs to be finished before the second card might start. Dependencies help to make connections between tasks more visual and the whole projects – more manageable.
- And the last thing – display Milestones to show key events.
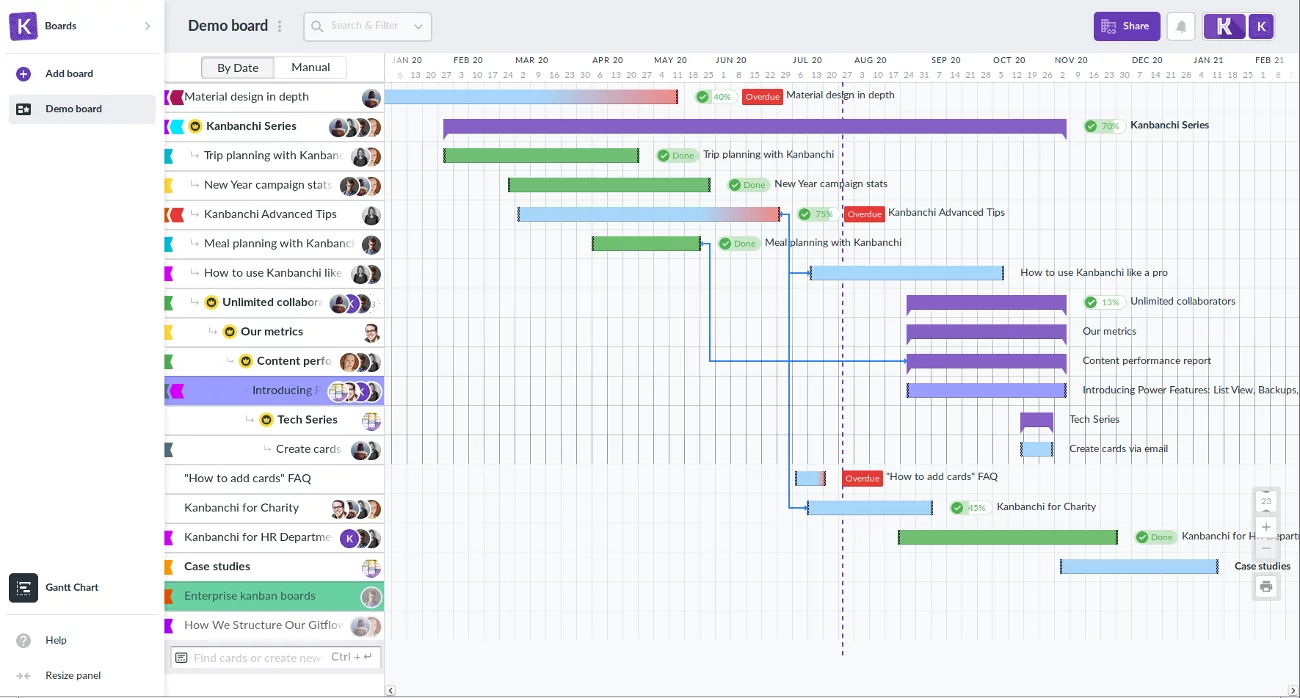
Now your Gantt chart may look something close to this one
Step 3: Enjoy completing the project with your neat Gantt chart! As the project moves along update your chart to reflect all the changes and the progress. This will help you to keep your plans and your team up to date.
Related article: How Can a Gantt Chart Tool Help You with Your Projects?