In this Article:
Try Kanbanchi now
Start your free trial
A Gantt chart is one of the classic project management tools, providing a visual representation of the tasks required to complete a project
Horizontal bars depict the main project timeline elements, showing task sequences, duration, and the start and end dates for each task. Gantt charts help teams organize timelines, track dependencies, and maintain transparency across projects, simplifying the scheduling, management, and monitoring of specific tasks and resources in a project.
Although not a new tool, Gantt charts have seen a resurgence in project management since the widespread uptake of cloud-based, team project management tools, such as Kanbanchi—and they are now used in every type of project from infrastructure engineering to software development.
Let’s take an in-depth look at the key benefits of a Gantt chart usage in project management, as well as some of the tools that can simplify the process of creating Gantt charts, and the key mistakes to avoid.
Gantt charts have lasted the distance in project management largely because they simplify the scheduling, management, and monitoring of specific project tasks and resources.
They remain the most commonly used chart in project management, even with the rise of Kanban boards and other visual representation tool options in project management software. Can any software that fails to include Gantt charts really be called “project management software”?
The main benefits of Gantt charts in project management lie in the simplification of project planning, coordination, and oversight from start to finish. They help teams manage multiple tasks, track dependencies, and maintain deadlines, while improving areas like team communication and focus, planning effectiveness, resource allocation, and more.
Simple, at-a-glance timelines help project managers clearly visualize complex workflows that highlight the completion of each task, indicate how the tasks relate to each other and provide an overview of the project’s main activities and overall progress. Project managers within teams of all sizes can identify bottlenecks and make informed decisions on how to progress a project.
Using a Gantt chart helps visualize project timelines, monitor progress, and manage resources efficiently.
It’s time to break down the main benefits of using a Gantt chart with a deeper dive. The following are eight of the main Gantt chart advantages:
Gantt charts simplify complex project timelines using horizontal progress bars in a calendar-based timeline. This is easy to read quickly by almost any team member, regardless of their technical level.
Project team members and stakeholders without project management expertise can view and understand the project flow as represented in days, weeks or months on the chart. This is often simpler than communicating in text about timelines and workflows.
Every team member can instantly understand when work starts, how long it lasts, and when it ends, helping them plan and coordinate tasks and manage deadlines.
One of the natural side-benefits of using a Gantt chart is that team coordination and accountability are improved, due to clearer task visualization and simpler scheduling.
Team members viewing the project’s Gantt chart will be on the same page with task responsibilities, progress, and deadlines. They can coordinate work according to schedules so that no important project milestones are missed.
Project managers can assign tasks according to team member availability. With access to the Gantt chart, team members understand their specific responsibilities and how their performance affects the wider project goals. This encourages them to take ownership of the tasks assigned and remain accountable for completing them.
Dependencies are essential when managing projects. Using a Gantt chart benefits teams by helping members visualize dependencies, clearly showing how one task’s delay affects others.
Gantt charts link related tasks with arrows or connecting lines, making it easy to see the order of activities and how one step leads to the next. They can also help highlight critical paths for keeping a project on schedule, identify bottlenecks, and support rescheduling if necessary.
With Gantt charts, team members have a visual map of all project tasks, timelines, and dependencies in a single view, encouraging prioritization, coordination, and collaboration, ultimately aiding productivity.
Team members can view changes, updates, and task status in real-time—another of the main benefits of Gantt chart software over the traditional “offline” charts designed in the early twentieth century.
Being able to track project progress intuitively in real time from start to finish helps managers maintain a good overview of progress without micromanaging—but with the information available to intervene if bottlenecks or backlogged tasks are identified or other problems arise.
The chart features visual indicators (bars) displaying the percentage of completion for each task. This can act as an early warning system, enabling managers to prevent delays and steer the project towards the next milestone.
Another of the benefits of using Gantt chart software tools is that they centralize resource planning/management and cost-tracking. There’s no need to run separate spreadsheets or apps—it can all be done from the software.
So, with Gantt chart software, you can not only assign team members to tasks but also set budgets and monitor the time spent on tasks, enhancing efficiency from a central project management hub.
For team leaders and project managers, all the data to make informed decisions is available at your fingertips, ensuring that no team members or resources are overloaded and that costs are kept under control.
We’ve already mentioned this but one of the main Gantt chart advantages lies in helping to identify and remove project bottlenecks, which can cause delays, blow budgets, and annoy clients.
For instance, Gantt charts highlight task overlaps and dependencies. If multiple tasks rely on one person or step, this can signal potential delays. The timeline also highlights delayed or slow-moving tasks and visualizes workload distribution, which can flag if certain team members or departments are overloaded.
Also, because the best software-based Gantt charts highlight the “critical path” tasks that directly affect the entire project’s end date, teams can focus on clearing the main obstacles in the way. If bottlenecks appear, teams can easily reschedule, reassign, or redistribute resources within the chart to restore acceptable workflows.
All teams, but especially remote teams, can struggle to remain aligned, motivated, and productive without the right tools for managing projects, maintaining communication, and enabling proactive collaboration.
Another of the advantages of Gantt chart usage in such teams is that the software can provide a centralized platform where team members can interact and work together. They can easily see their roles within a project, giving their work meaning and context, while also understanding how their work progresses the project. This raises motivation and “buy-in” to the main project goals, which is generally better for team alignment and productivity.
When you’re considering the advantages of a Gantt chart in project management, don’t forget the broad benefit of enabling real-time, data-driven decision-making.
Gantt charts help project managers do this in several ways:
The best project management software solutions offer far more than simple Gantt chart templates. They integrate Gantt charts seamlessly into their suite of tools, automating updates and syncing with other views, enabling productive team collaboration.
Unlike traditional Gantt charts, these tools are interactive, collaborative, and automated, facilitating the process of creating, updating, accessing, and working together on projects.
Kanbanchi, for instance, is known as a Kanban board-based project management tool designed for Google Workspace users. However, it offers Gantt charts in its Professional plan, which is designed for teams with advanced project planning and time-tracking needs when collaborating on complex projects.
Kanbanchi simplifies the creation and use of Gantt charts, helping teams collaborate on and track projects easily. Users can create Gantt charts in a few simple steps (see the dedicated section below) and simplify project management with the following types of features:
Kanbanchi’s strongest benefits include its built-in Gantt view (no third-party apps are required) and its seamless integration with Drive, Sheets, and Calendar. This helps to remove many of the traditional pain points experienced by Gantt chart users, such as:
For Google Workspace users, Kanbanchi is ideal for combining simple task visualization, team collaboration, and automatic updates in one interface. It offers all of the benefits of Gantt chart usage outlined above when managing multiple dynamic and complex projects.
You can try Kanbanchi for free for 7 days and check out all of its main project management features, including Gantt charts!
BOOK A FREE TRIAL OF KANBANCHI
To start experiencing the many benefits of a Gantt chart for project management within Kanbanchi, follow these simple steps:
Open Kanbanchi from Google Workspace. Click “Create board” on the dashboard, name your project, and choose a layout (Kanban or Blank Board) to begin.
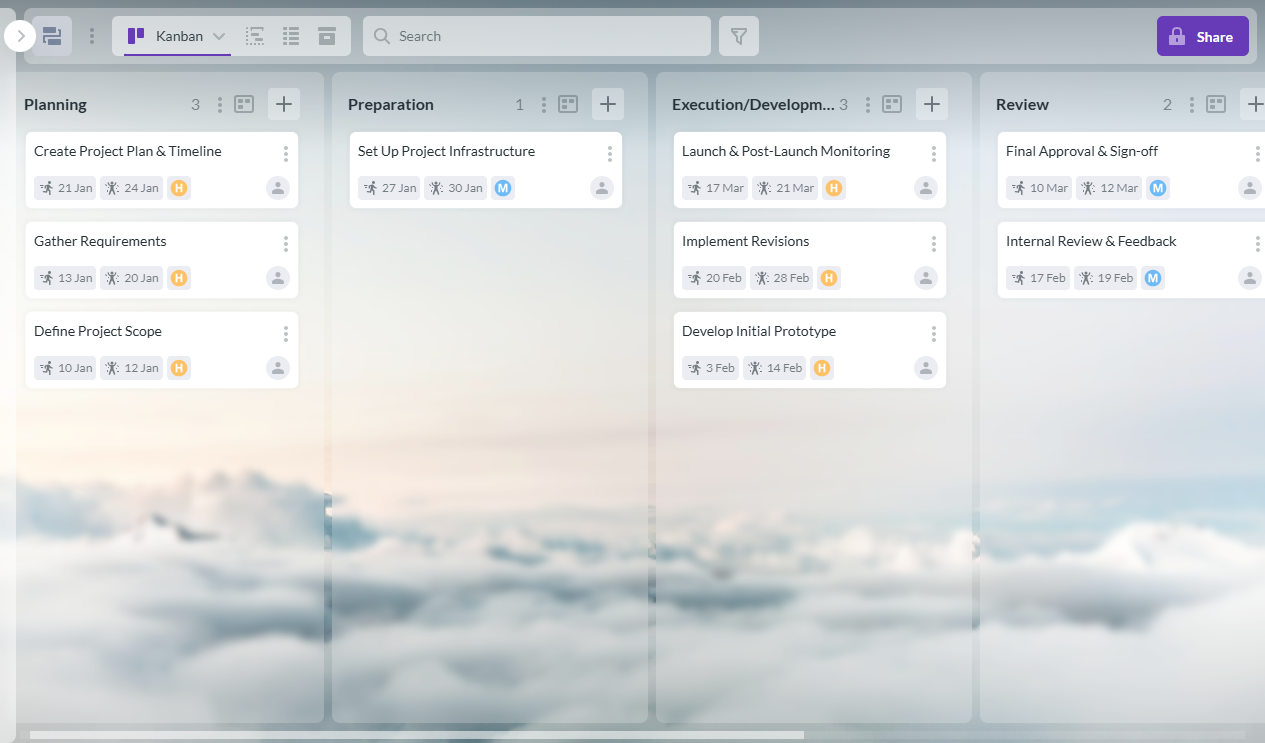
Use the task board to plan and schedule tasks, providing a clear overview
Create cards for each task, open each card’s details, and set the Start date and Due date fields to define your project timeline.
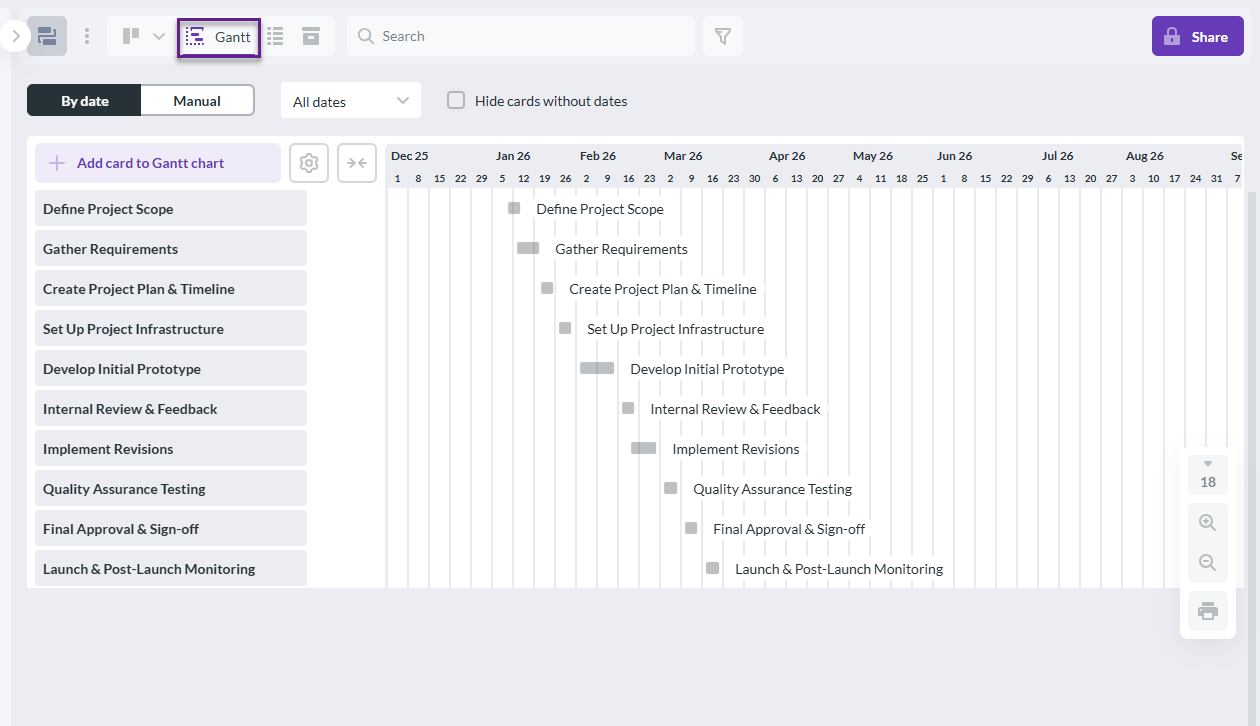
A simple Gantt chart view provides a clear overview of task start and end dates for effective project planning.
Select the Gantt Chart option from the top panel to display all tasks as timeline bars across the calendar view.
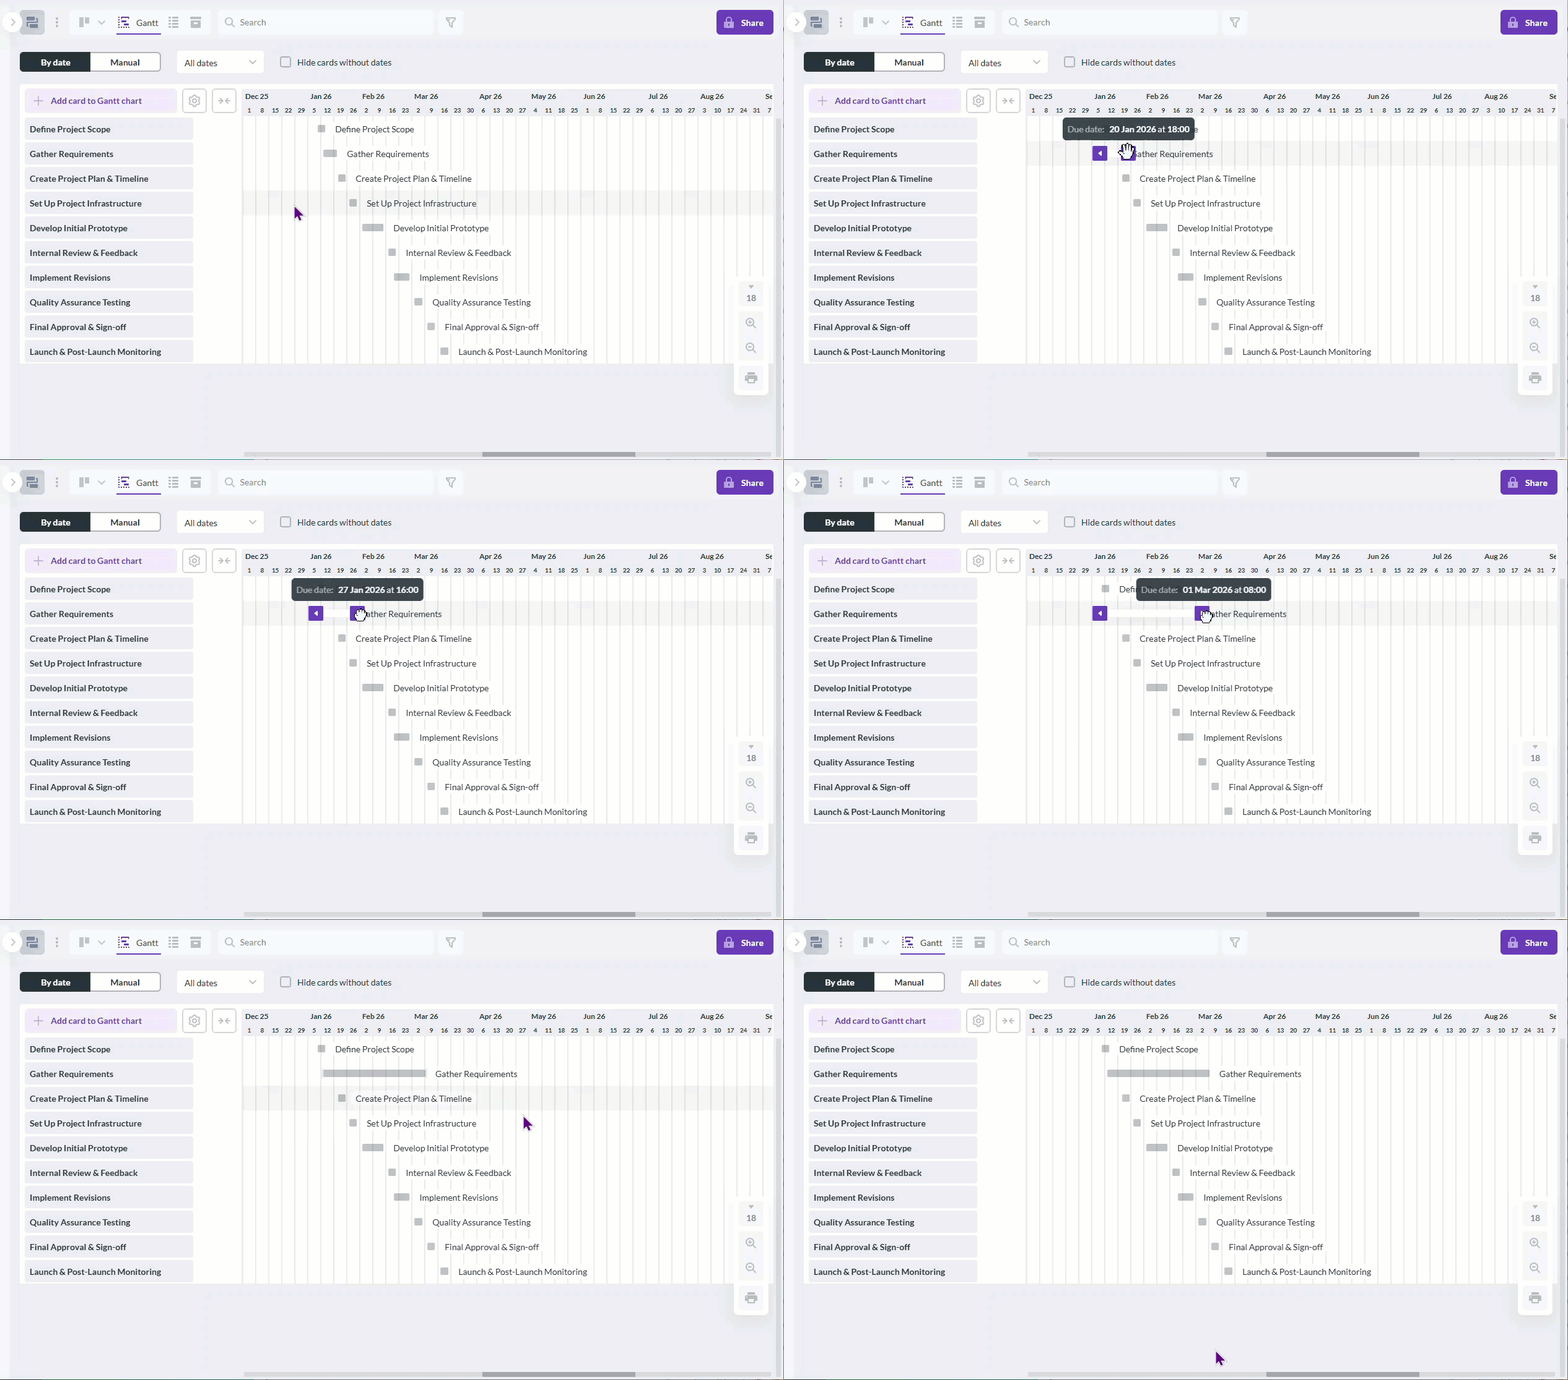
Animated GIF showing a task being dragged to adjust dates in a Gantt chart
In the Gantt chart, drag task bars horizontally to change start or end dates—the board will update automatically.
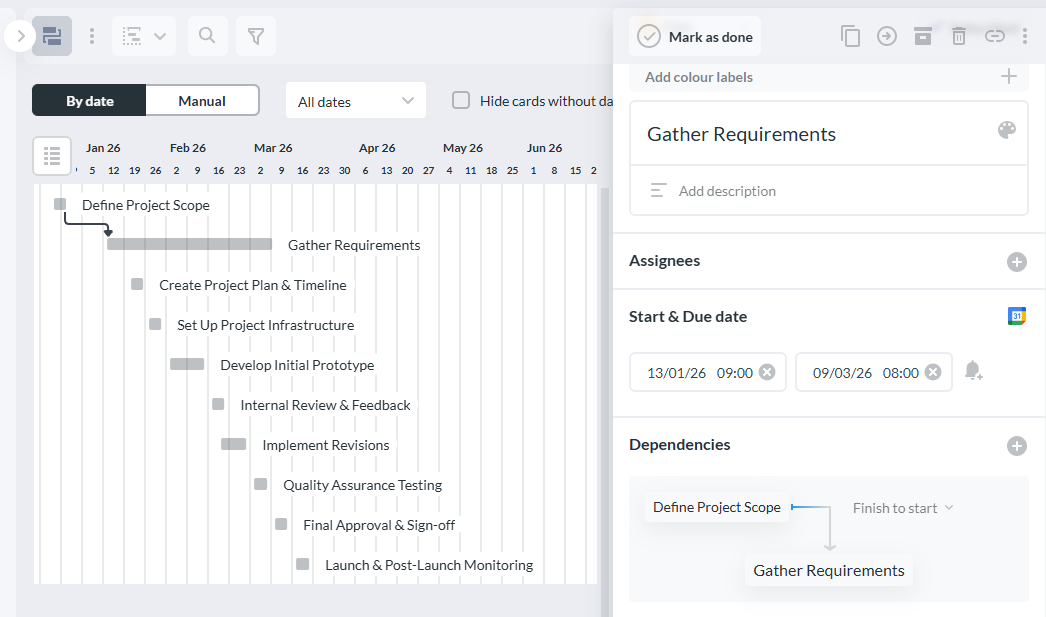
Using a Gantt chart with dependencies allows project managers to visualize linked tasks and ensure smooth workflow coordination.
To set dependencies, open a card, go to the Dependencies section, and select another card from the list (or search by name). You can choose different dependency types — Finish-to-Start, Start-to-Start, Finish-to-Finish, or Start-to-Finish — by selecting them in the card’s dependency menu.
If the schedule violates your dependency logic (for example, a task is set to start before its predecessor finishes), Kanbanchi highlights the link in red to warn you.
As team members update cards or dates, the Gantt chart refreshes instantly, allowing members to view live progress and schedule adjustments.
Try Kanbanchi’s Gantt chart view to start planning your next project.
The main Gantt chart pros and cons have been covered above but common mistakes prevent some teams from enjoying the full benefits of Gantt charts and reduce their effectiveness.
Kanbanchi can help prevent many of these common errors, including:
For modern project management teams, Gantt charts are an essential part of the “kitbag”. They bring visualization, coordination, and control to teams looking to improve productivity through better collaboration.
The centralized and structured approach to project management provided by Kanbanchi can be a game-changer for Google Workspace-based teams who currently use a range of different apps and tools to achieve their project management goals. Kanbanchi can help you bring it all together seamlessly within your existing software environment, reducing clutter and improving efficiency.
Try Kanbanchi’s Gantt chart feature today
A Gantt chart is used as a dynamic, visual representation of the progress of a project, highlighting the tasks required to complete it. Horizontal bars represent the project timeline, helping teams organize timelines, track dependencies, and maintain transparency across projects.
The main benefits of using a Gantt chart are better visualization, coordination, and control for teams, which often enhances project collaboration, efficiency, and, ultimately, productivity.
Gantt chart software improves collaboration by providing team members with a clear, shared, up-to-date view of project timelines, task dependencies, and responsibilities. Real-time updates and in-app communication channels ensure that everyone is aligned on progress and deadlines.
Kanbanchi’s Gantt chart stands out because it’s fully integrated with Google Workspace, allowing seamless collaboration within familiar Google tools. It updates automatically as tasks change in Kanban or task lists, keeping all project views perfectly synchronized.
In this Article:
Start using Kanbanchi now
Start your free trial