
Can Google Calendar Show a Gantt Chart?
No. Google Calendar has no Gantt chart view, and there is no setting, add-on menu, or hidden option that turns one on.
That answer surprises people, because Calendar already draws things across dates. A multi-day event appears as a bar. Several events stacked look, at a glance, a bit like a timeline. So the assumption is reasonable. It just does not hold, and the reason matters more than the missing feature.
What Google Calendar actually shows
Calendar answers one question: what is happening, and when.
It places events on a grid by date and time. A multi-day event does render as a horizontal bar, which is the visual similarity that starts the confusion. But that bar is an appointment. It has a start, an end, and nothing else.
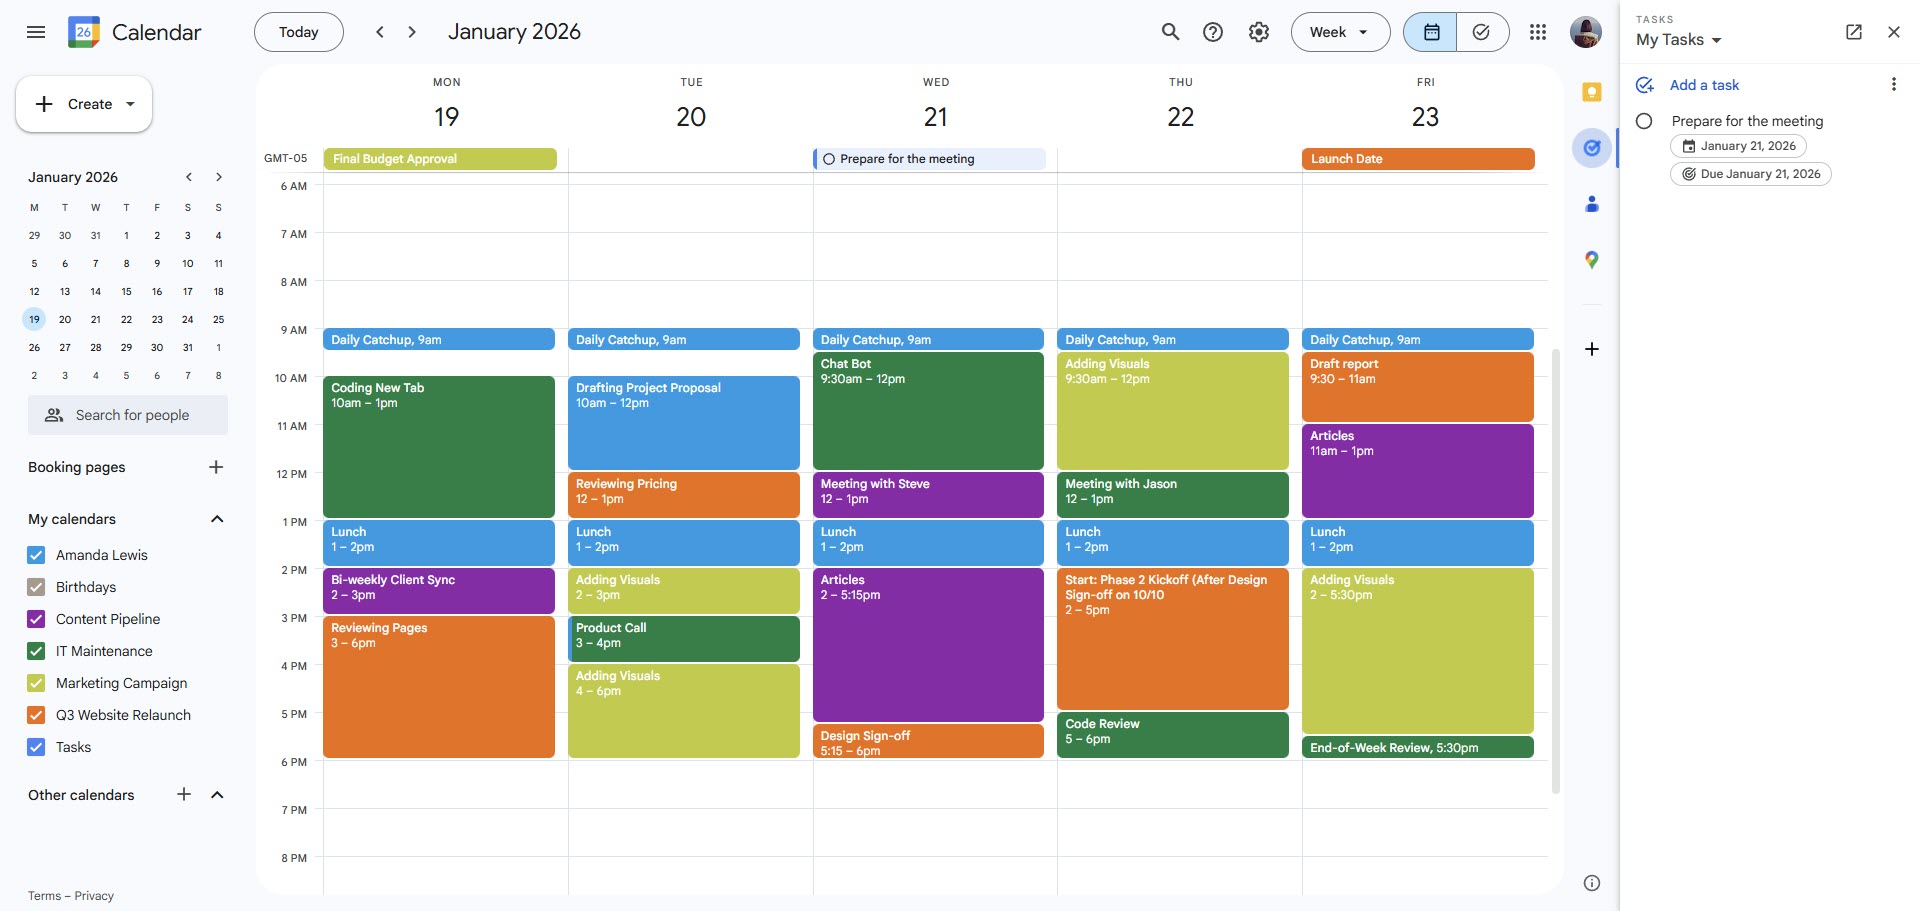
Google Calendar displaying events
A Gantt chart answers a different question: how do these pieces of work relate to each other, and what happens if one of them slips? That difference is not cosmetic. It is four missing capabilities.
- No dependencies. In a Gantt chart, you can say testing cannot begin until development finishes. Calendar has no concept of one event depending on another. Move the first and the second stays exactly where it was.
- No task hierarchy. Gantt charts group work into phases with parent and child tasks. Calendar events are flat. Every item sits at the same level.
- No progress. A Gantt bar can show 60% complete. A calendar event is either in the past or the future.
- No critical path. A Gantt chart can tell you which delays threaten your end date and which do not. Calendar has no way to model that, because it does not know the items are connected.
Put simply: Calendar is a record of commitments in time. A Gantt chart is a model of how work fits together. You can draw one on the other, but the logic does not come with it.
The workarounds people try
Three approaches come up repeatedly. All of them work to a point.
- Creating multi-day events as fake task bars. Block out “Design phase” from the 3rd to the 14th, and it looks like a Gantt row. This is fine for a handful of items on a short project. It falls apart the moment a date moves, because nothing else moves with it, and you cannot see at a glance which items are late.
- Color-coding by phase or owner. Genuinely useful for readability, and worth doing regardless. It does not add any scheduling logic.
- Using a separate calendar per workstream. Toggling calendars on and off gives you something like filtering. Again, useful, and again, no dependencies.
The honest summary: these make Calendar more readable. None of them makes it a planning tool.
What Google offers instead
Google Sheets Timeline view is the closest native option. Available on Business Standard tiers and above, it renders rows of data as bars across a date range. It is a genuine timeline view rather than a chart hack.
What it still lacks is the same list as above: dependencies, auto-scheduling, critical path. It shows your dates; it does not calculate consequences. For a small static project that is often enough.
Google Tasks handles individual to-dos with due dates and appears alongside Calendar, but it is a list, not a timeline.
Beyond that, Google’s position is that the Workspace Marketplace fills the gap, which is why third-party tools exist for this rather than a native Gantt feature.
What to use if you need a real Gantt chart
If your work has dependencies and fixed dates, you need a tool that understands both.
Kanbanchi runs inside Google Workspace and provides a Gantt chart view of your project boards, with dependencies between tasks, milestones for key dates, and drag-to-reschedule. Boards are stored as files in your Google Drive, and card dates can be pushed to Google Calendar. So your deadlines still appear where your team already looks, while the scheduling logic lives somewhere that can actually handle it.
That combination is usually what people are looking for when they search for a Calendar Gantt chart: the timeline in a tool built for it, and the dates visible in the calendar they check every morning.
For the wider picture on Gantt options across Google’s tools, see “Does Google Workspace have a Gantt chart?”
Other Frequently Asked Questions
Does Google Calendar have a Gantt chart view?
No. Google Calendar has day, week, month, year, and schedule views. None of them is a Gantt chart, and there is no add-on setting that adds one. Multi-day events render as bars, which look similar, but they carry no dependencies, hierarchy, or progress.
Can you convert a Google Calendar to a Gantt chart?
Not directly. You can export calendar data and rebuild it as a timeline in Google Sheets or a project tool, but this is a manual copy rather than a conversion. The result will not update when your calendar changes or vice versa.
What is the closest thing to a Gantt chart in Google?
Google Sheets Timeline view, available on Business Standard and higher. It displays rows of dated data as bars across a timeline. It is a real timeline view, but it has no dependencies, no auto-scheduling, and no critical path.
Can I see project dependencies in Google Calendar?
No. Calendar has no concept of one event depending on another. If a task slips, nothing downstream moves. Dependency logic requires a tool built for scheduling.
How do I get my project timeline into Google Calendar?
The practical approach is the other way round: plan in a tool that handles timelines, then push the dates to Calendar so deadlines appear alongside your meetings. Kanbanchi can add card dates to Google Calendar, which keeps deadlines visible without asking Calendar to do scheduling it was not built for.