In this Article:
Try Kanbanchi now
Start your free trial


Most likely, you’ve already come across the term “Gantt chart” and probably know about this valuable tool in broad strokes. Want to enhance understanding and learn more on how to use the Gantt chart? This article is here to help you to handle this.
Named after its inventor – Henry Laurence Gantt – the chart serves as a visual work schedule representation. The chart was considered revolutionary when introduced. However, nowadays the chart is widely used in project management. Therefore, it is important to master it and apply the knowledge to the benefit of the workflow.
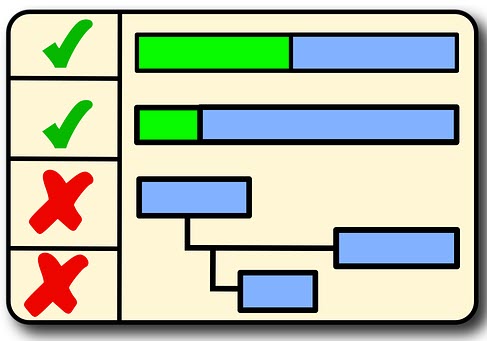
In simple terms, the Gantt chart tools show the list of tasks organized on a timeline in an easily understood way. Just in a glance, you can what is coming next, observe key dates, task duration and the way the items are interdependent.
Moreover, the tool is suitable for small projects or complex structures. So if you are curious, you will definitely be able to utilize Gantts charts in various project types once you learn how to build, use and interpret the chart.
It is difficult to overestimate the Gantt chart. Apparently, it has become irreplaceable in education and business. Simple yet powerful, the Gantt chart brings a range of advantages.
Certainly, we’ve already described some reasons to start using the Gantt chart. But what specifically can the Gantt chart bring to your business? Let’s figure it out.
The Gantt chart was invented more than 100 years ago. Of course, originally people used good old pencil and paper to build one. Luckily, now we can rely on computers and specialized tools. Taking into account Cloud computing, it is so much easier to use charts in teams as they provide facilities for real-time collaboration. The market of the Gantt chart tools has plenty of apps to choose from. However, there is a particular tool that has everything you need.
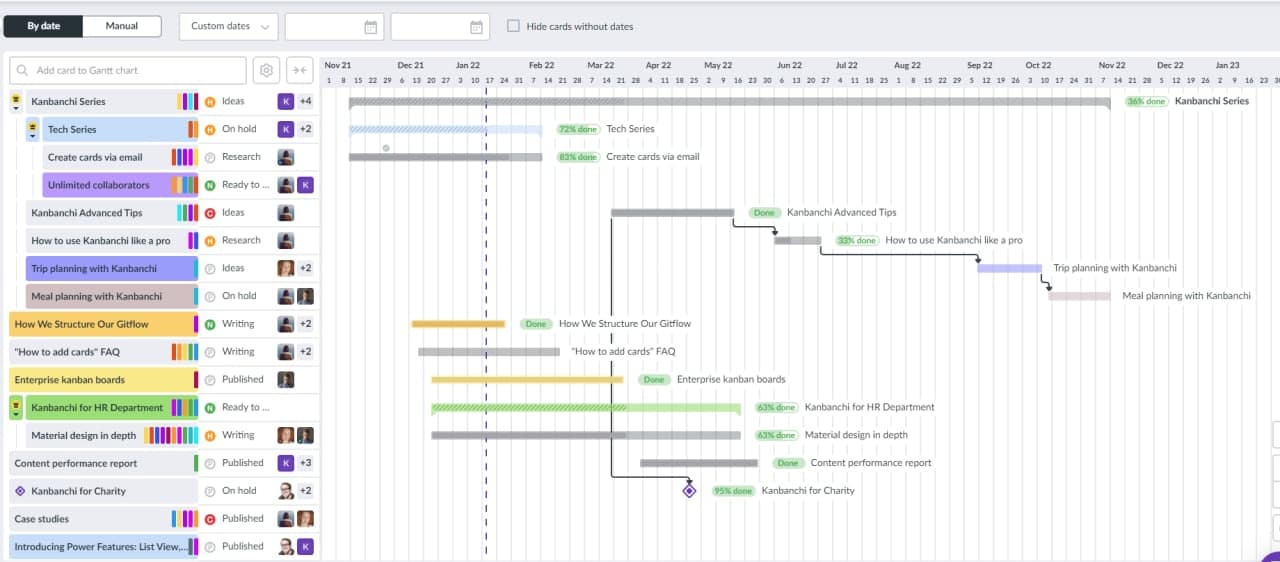
Kanbanchi is a perfect solution for project management where you can build Gantt charts for your projects. Those who like to observe data from different angles might be especially excited about Kanbanchi as it offers a Kanban board, Gantt chart and the Task list that are interdependent. Despite the powerful features, Kanbanchi is easy to use.
Kanbanchi Gantt chart is customizable – you may choose what task data you would like to observe. In case you’d like to focus on the chart you may collapse the list of tasks. The chart shows the statuses of tasks, their timeframes, connections and interdependencies. Important dates can become milestones and be marked with the diamond symbol on the chart.
You may utilize Kanbanchi for any project in any industry. It is a versatile tool that fits small businesses and enterprises. Try it out to see how easy project management can be!
Related articles:
Why do you need a Gantt chart application?
How Can a Gantt Chart Tool Help You with Your Projects?


In this Article:
Build your Gantt chart in Kanbanchi!
Start your free trial