How does Gantt chart work?
A Gantt chart is simple when you know how to set it up. Gantt Chart is a graphical display of your project’s workflow. It shows start and due dates for all project elements and includes tasks, milestones and dependencies. A nicely organized Gantt can simplify any project planning process.
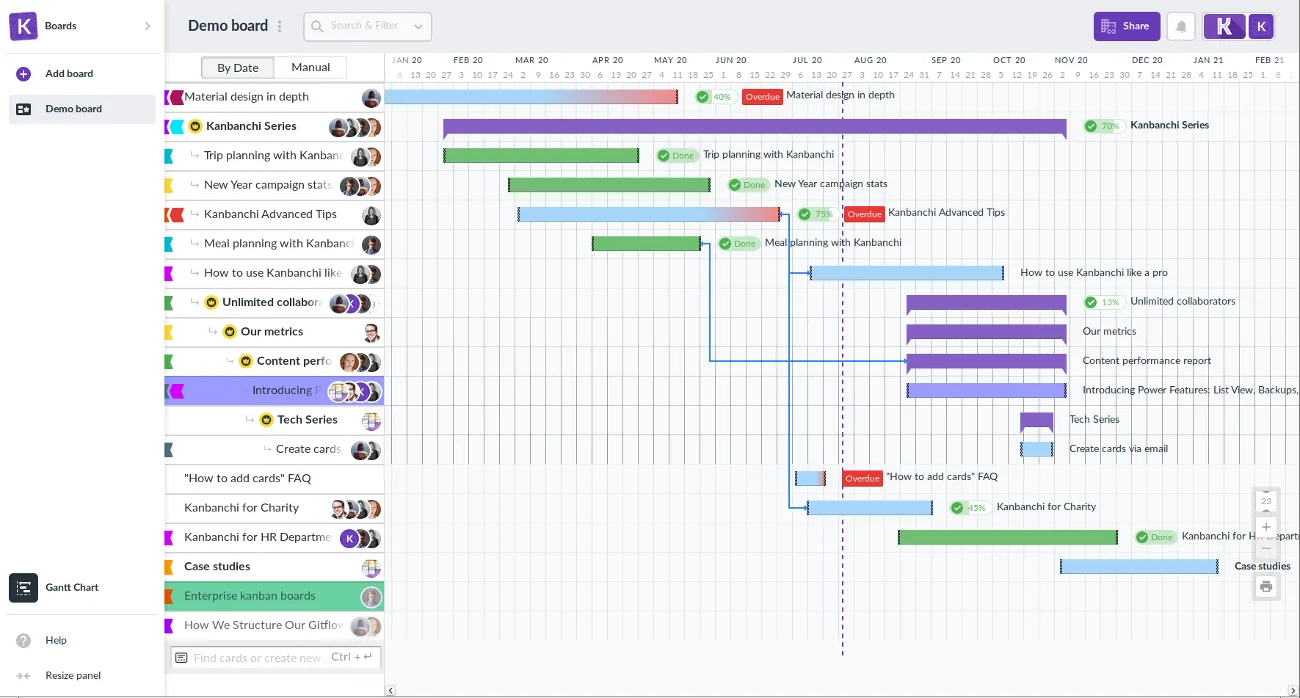
Let’s see how you can create a nice Gantt and organize your projects with Kanbanchi, task management and project management tool integrated with Google Workspace.
Step 1. Gantt diagram setup
First of all, think over the whole project and divide it into manageable tasks. Then set up a card for each task, assign the cards to your colleagues. Don’t forget to add Start and Due dates to each card and check the Show on Gantt option. The cards may be shown automatically on Gantt Chart if you set this option in the Board settings.
Step 2. Task relations and dependencies
Distinguish task relationships and distribute dependencies between the cards:
- Set Epic adding or creating Subcards. It will let you track the Epics’ progress;
- Link cards through a simple Finish-To-Start Dependency using the Dependencies feature. It will show that the first card needs to be finished before the second card might start. Dependencies help to make connections between tasks more visual and the whole project – more manageable;
- Display Milestones to show key events.
Step 3. Gantt diagram update
As the project moves on, update your chart to reflect the progress. It will help you to keep you and your team updated. Enjoy completing the project with your neat Gantt chart!
Related article: How Can a Gantt Chart Tool Help You with Your Projects?