Anyone who has used the Google Workspace suite of tools knows that it offers a range of products to improve your productivity. The likes of Calendar, Gmail, and Docs are all great tools that can help any team to collaborate more closely at all times. Yet, you may wonder whether there is a Google Gantt chart for you to use too.
With no dedicated Gantt chart in the suite, one possible solution is to use spreadsheets as a way of creating these project charts. While this can work in some situations, it is a manual workaround that may create a lot of extra work. Also, it means using a tool for something that it wasn’t really built to do.
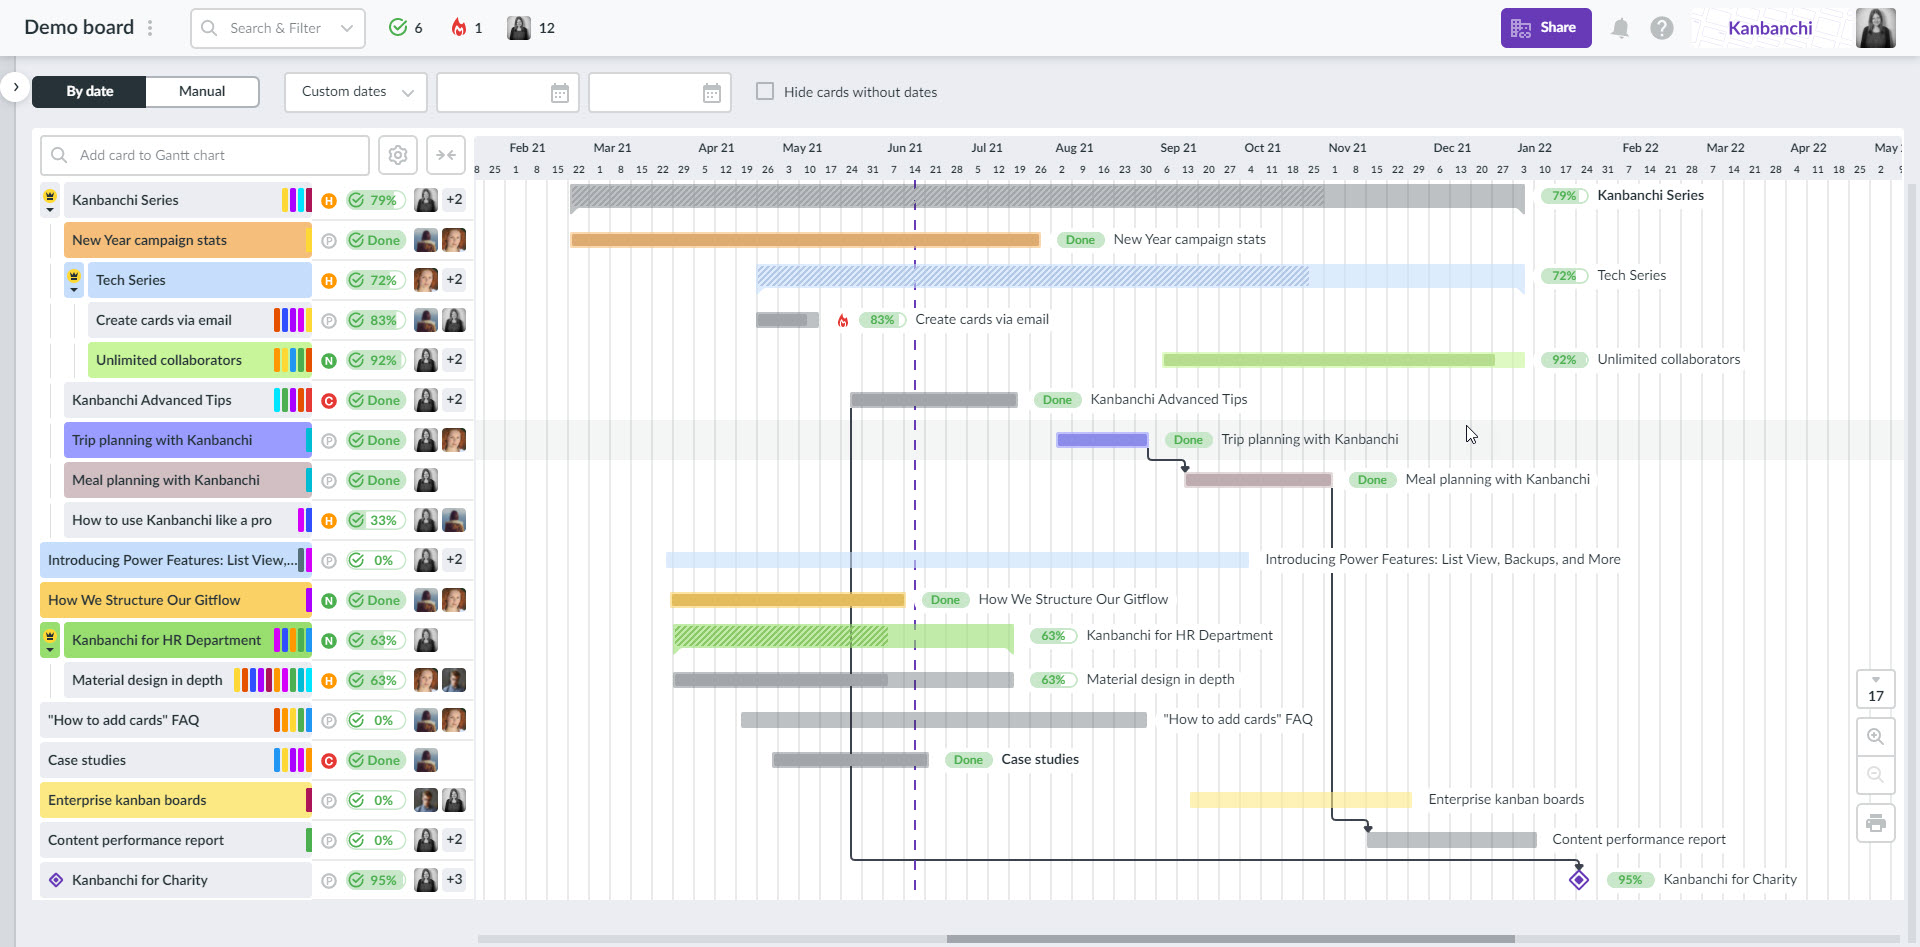
A better way of getting hold of a useful Google Gantt chart is to use Kanbanchi. This is a piece of software that integrates perfectly with your Google Drive, to give your team members easy access to your project plans at all times
In fact, Kanbanchi offers more than just a Gantt chart, as it is a complete project management tool that also gives you a Kanban board, time tracker, and a range of other tools to help your team to work better.
It integrates with Workspace and uses a similar type of interface. You can use this alternative Google Gantt chart very easily and right away with no need for extensive training materials. The Gantt chart is extremely simple to use. It contains all of the features that you need to keep your projects on track at all times.
Don’t miss out on the simple efficiency of the Gantt chart approach when you use Google Workspace. By choosing the right tool, you can run smoother projects using Kanbanchi.
2. Does Google Workspace Offer A Project Management App?
A big number of companies and businesses are already enjoying the services that Google Workspace offers to its clients. Google created a bunch of tools and apps for small to large-sized companies. It promotes more flexibility in the lives of business owners. Since the days passed by, it has introduced new and latest apps that can be linked up with almost everything. But does Google Workspace offer a project management app?
There is nothing worse than trying to manage your work projects within a to-do list or spreadsheet. Spreadsheets are great for tracking your projects. However, when multiple people are working on the same project, you need one place to keep track of everything. That’s where project management software comes in handy.
The Importance of Using a Project Management App
Project management apps allow you to utilize your time by organizing things, scheduling, and easily communicating with others. Such apps also help you keep track of your activities and help you focus on a specific task at hand. By using these apps, you can easily create and manage tasks and deadlines, set reminders, contribute to teamwork using comments and chat, organize files into folders, and share them with other team members.
Nowadays, most project management apps can help users be more productive and stay organized throughout their day-to-day activities. They basically allow you to keep track of your tasks so as to always see where you are and analyze how far you have come. If you have a small team or a big organization, you need to leverage project management apps.
Does Google Workspace Offer a Project Management App?
Google Workspace, by default, doesn't provide any online project management tool. Some people tried to find third-party apps that would allow them to use separate apps for their project management needs. However, other users were not sure about whether to use the third-party solutions because of possible security and privacy issues that could arise after switching to a different service provider.
So here's a great alternative solution for their project management needs. Kanbanchi is gaining popularity rapidly as an easy-to-use tool to keep track of all your tasks and projects in one place. If you are looking for a good solution to manage your projects, Kanbanchi might be exactly what you need. The task and project management app allows users to see the progress of their tasks, assign them to team members, and control the workflow of the entire team.
The great part is that Kanbanchi is integrated with Google Workspace, so you can open your Kanbanchi projects on Google Drive. Then, you can access all of your data and files seamlessly. Moreover, Kanbanchi makes it possible to collaborate with other team members without inconvenience.
Want to try the power of Kanbanchi and Google Workspace?
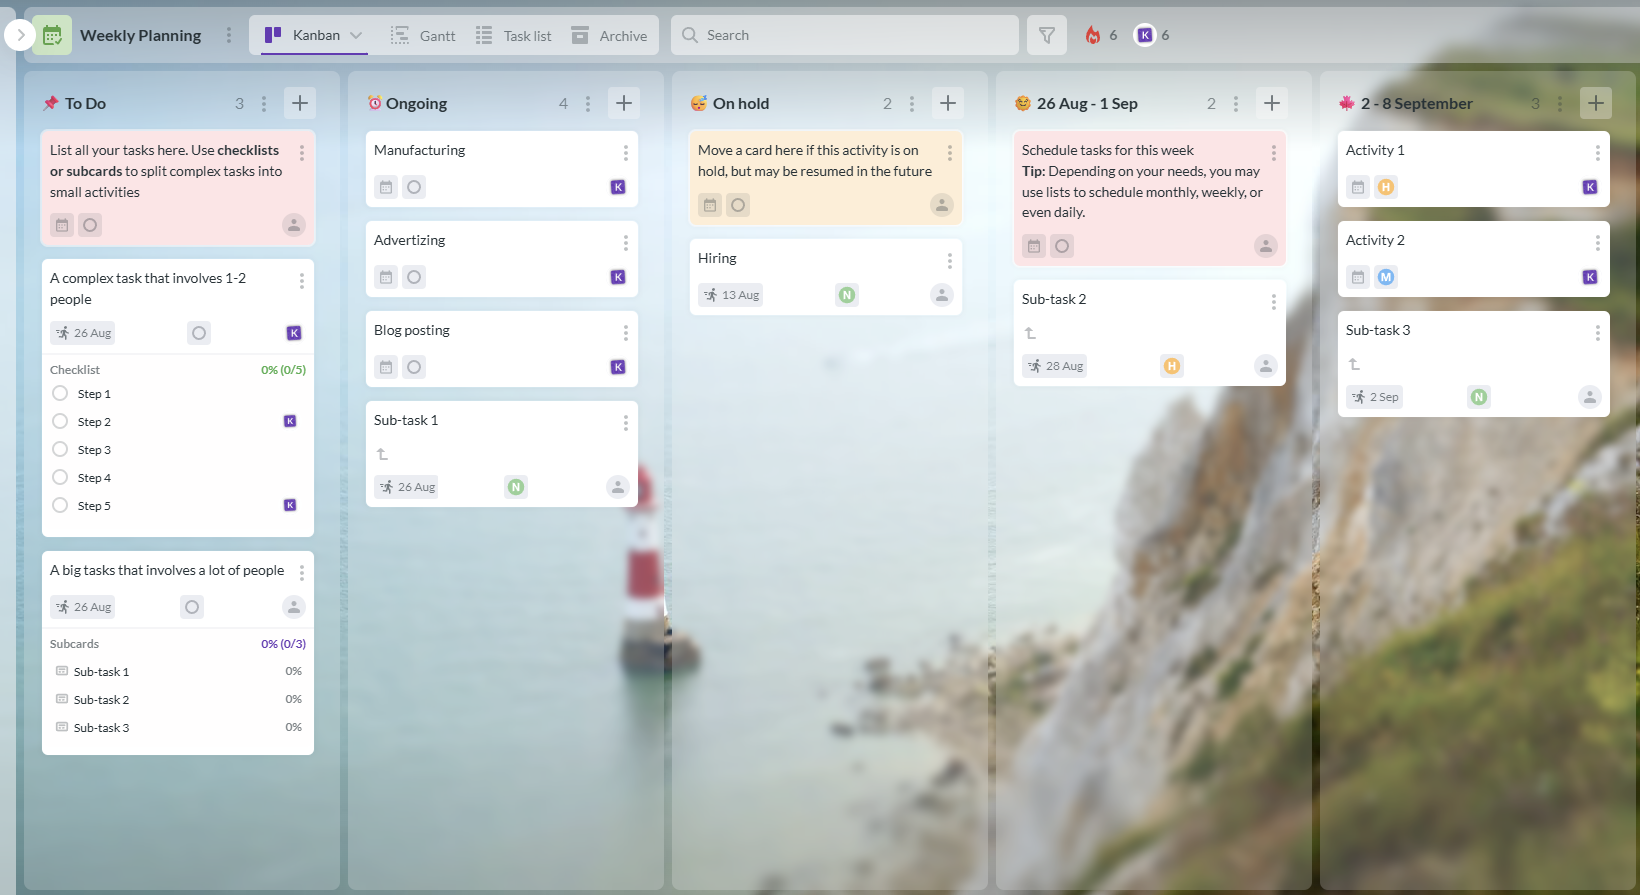
You should use Kanban boards to help visualize your work, and quickly get things done. Moving cards from "To Do" to "Doing" and then to "Done" makes the process easy and fun. Kanban boards usage increases yearly as more and more industries adopt this lightweight but powerful tool.
The Kanban method doesn't involve much control or strict structure of processes and therefore works perfectly in our modern ever-changing environment.
What are Kanban boards?
The term Kanban is a well-known methodology that originally comes from Japan. “Kanban” means “signboard”. At the time of its invention, it was a physical board with "signs" on it. Those signs were tasks that needed to be done during the production cycle. It was necessary to have something visual to understand what was going on.
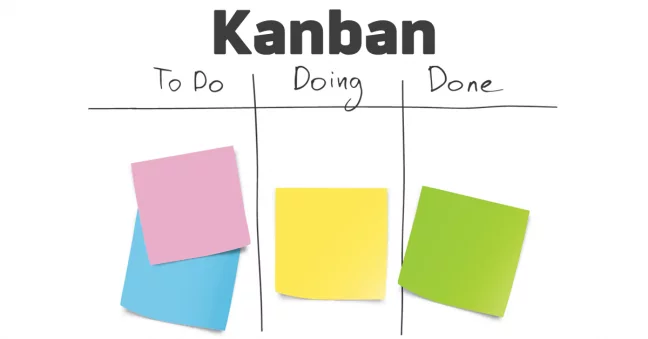
In the very simple form, the Kanban board has three lists, "To Do", "Doing" and "Done" representing three stages that tasks have regardless of work specific. The best short definition of a Kanban board would be "a workflow management tool that you use to visualize work stages".
Why should we use Kanban boards?
Kanban boards prove to work well for teams of any size in any industry. Any goal-oriented business, team or department could successfully adopt Kanban methodology. You can monitor your team activities, schedule personal tasks or plan complex projects, for any of these, the Kanban board will perform well.
If your team wants to have a visual representation of a workflow, have flexibility at work and improve collaboration, then Kanban boards will be a good option. You can tailor your Kanban board so that it reflects your unique process. It can be changed at any time, so it will evolve and grow together with your team.
When you have one ultimate place to store knowledge about the work you are doing, you will be able to eliminate all repeatable and unnecessary meetings and calls. Instead, your team will have deeper conversations and discussions because they will know most of the information in advance. It is one of the top advantages for distributed teams.
Kanban board helps to stay focused and organized. At any moment you will see what you need to finish before you start one more task. You will easily see the priorities of tasks and distinguish those to do first. Using Kanban boards helps to improve team efficiency.
To summarize it all, you should use Kanban boards because:
They help to visualize your work
They give your team great flexibility
They help you achieve better collaboration
They empower your team with an ultimate knowledge base
They unify distributed teams
They improve team efficiency
How do I start with a Kanban board?
Though you may have a physical Kanban board, it's obvious that nowadays it will be more helpful to have an online version. Among the apps that provide online Kanban boards, you may choose basic tools or more advanced software. Before you start evaluating our options, set the list of criteria.
Kanbanchi App has an online Kanban board in its simplest version. This application falls under one of the most important criteria - integration with Google Workspace. The quick sign-up process with your Google account allows you to start working with your team in ten minutes.
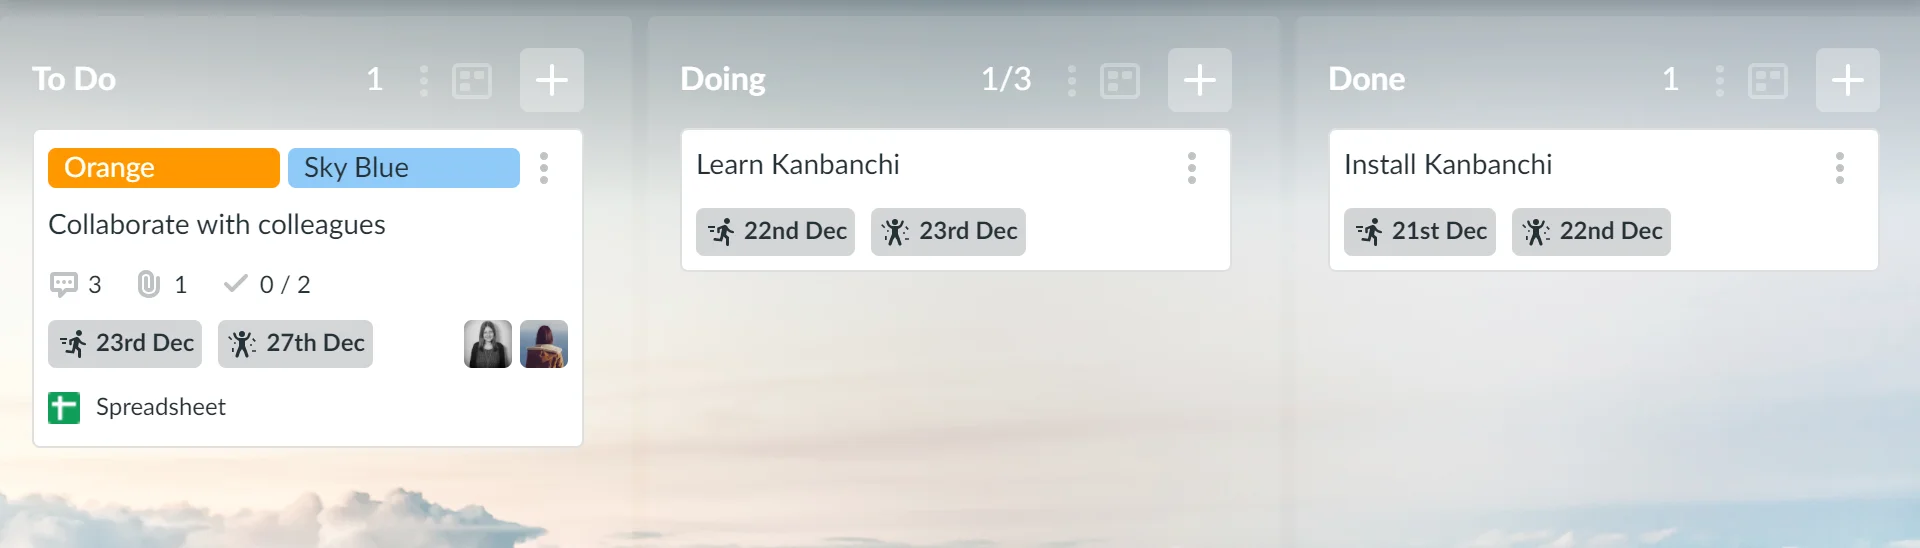
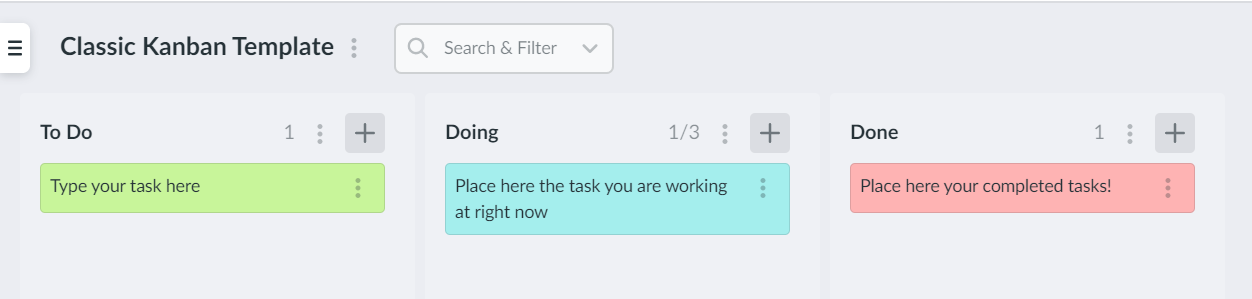
Kanbanchi is easy to learn, the interface could be mastered by the least tech-savvy person on your team. You start with that simplest Kanban board with three lists and later the tool will evolve together with your team.
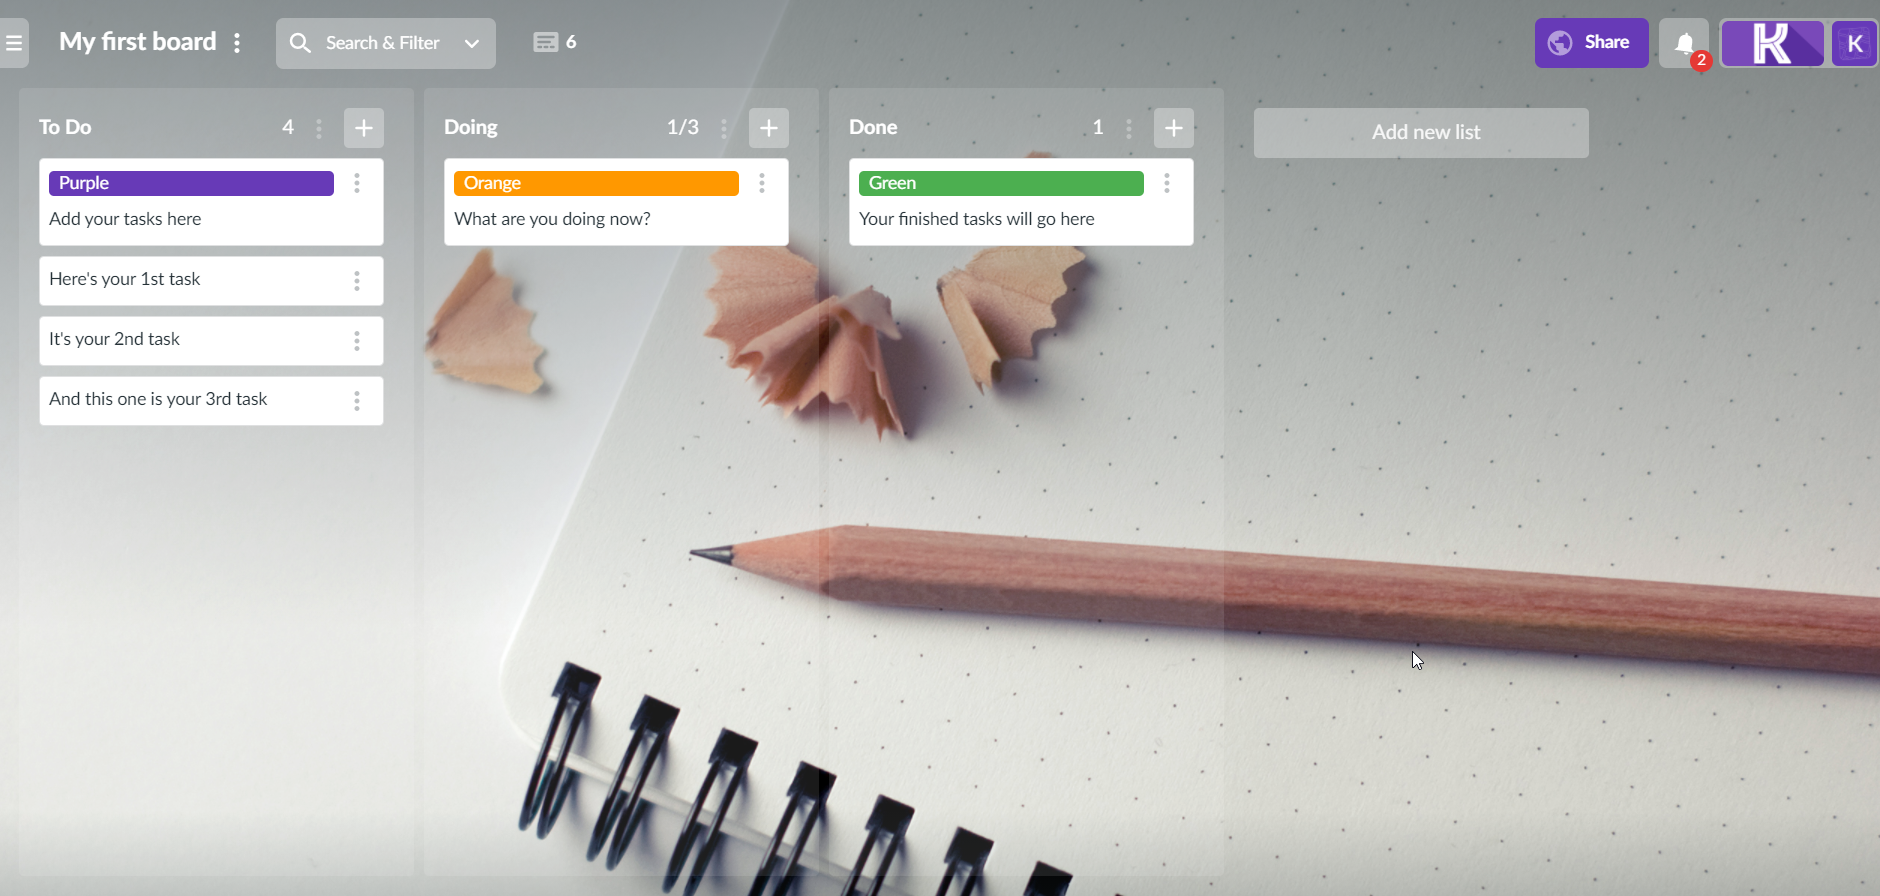
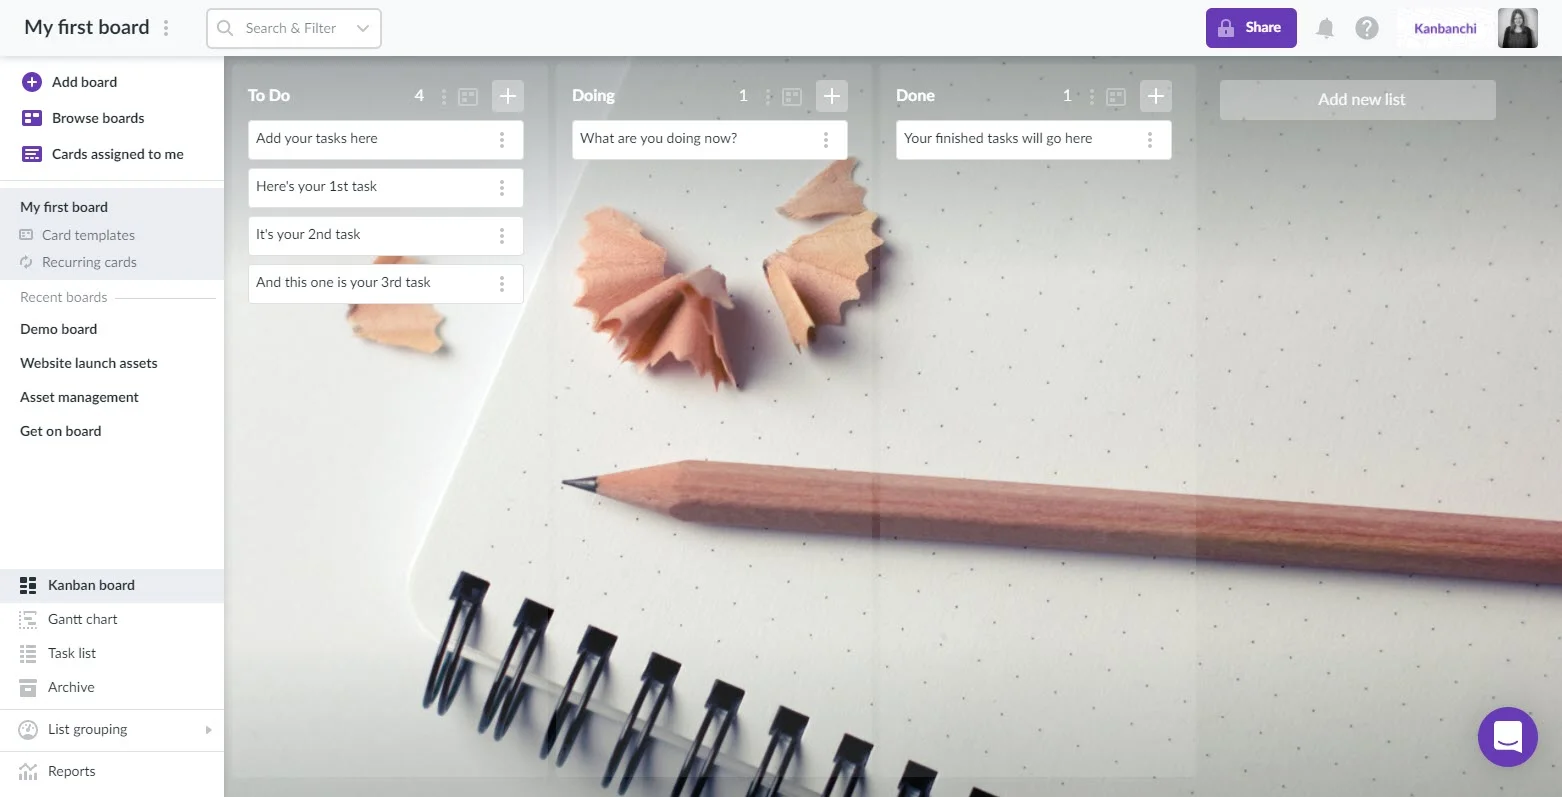
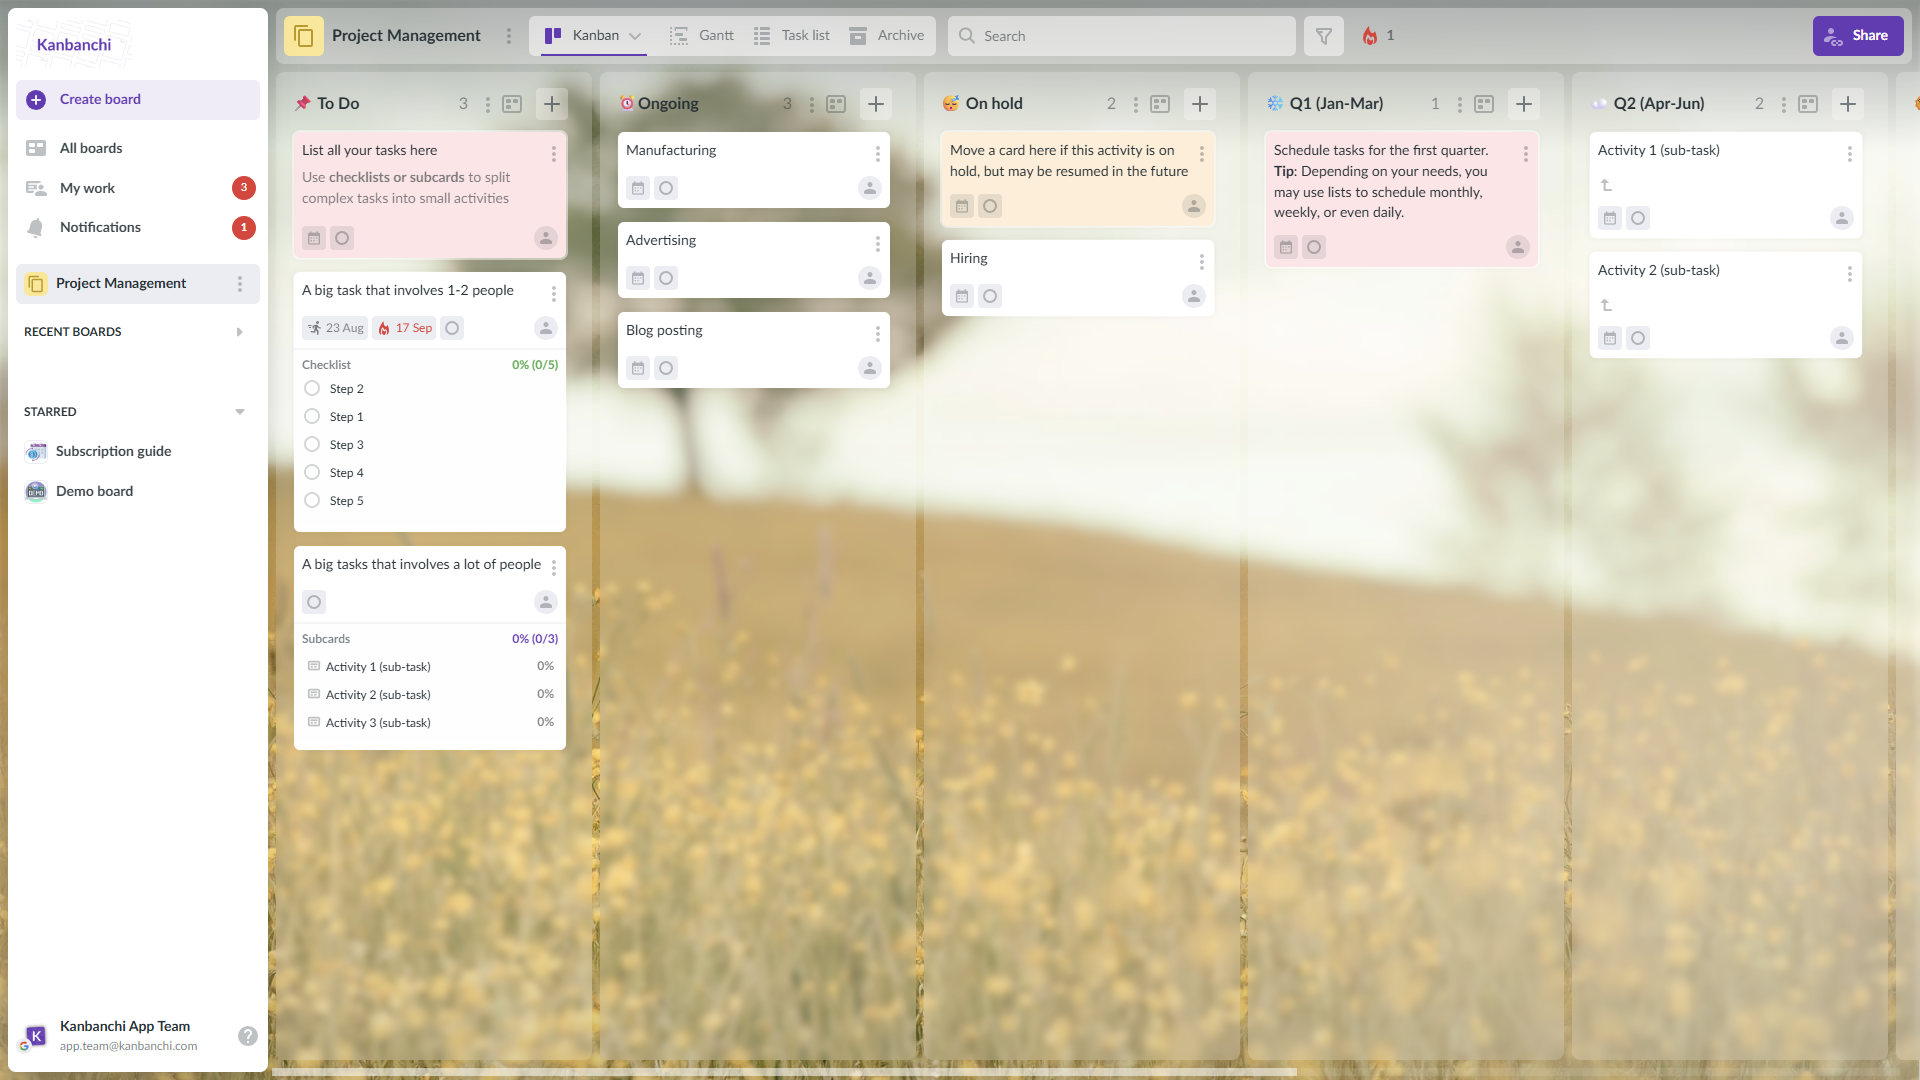
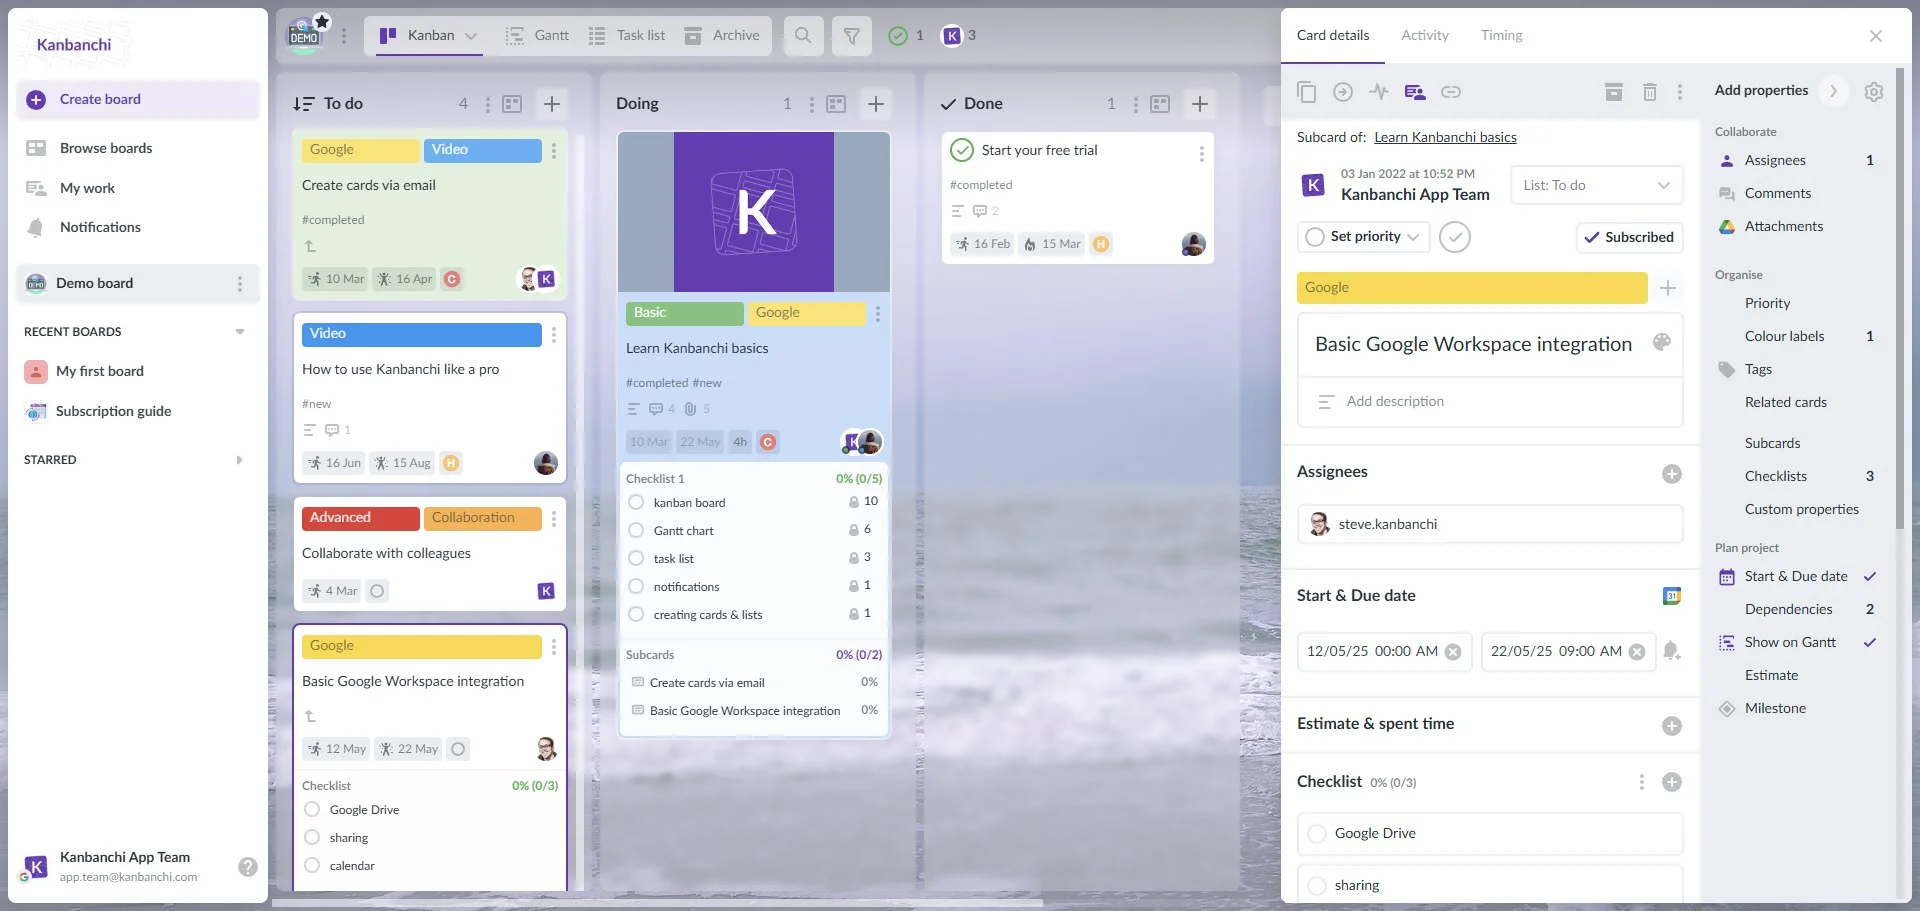
Simple Kanban board with three lists. "To Do", "Doing" and "Done".
Look at this board above! It has three tasks that you may start doing right now. Install Kanbanchi -> Learn Kanbanchi -> And start collaborating with your colleagues. Start with the free trial period and check it out.
4. What Is The Difference Between A Gantt Chart And A Calendar?
The Gantt Chart and Calendar are two essential features that help you track and manage your projects. Knowing how to get the most out of them saves you time, makes project coordination easier within your team, and helps you keep a realistic view of where you're at with your projects. If you take the time to understand how they work, you'll be able to make the most of them.
You might think the Gantt Chart and Calendar are the same things, but in reality, they’re a little different. The Gantt Chart is a graphical representation of all of your tasks, while the Calendar shows you deadlines in a calendar format. Let’s get to know both of these essential project management tools!
What Are These Tools?
The agile movement has clearly defined how to manage a project. Using Kanban boards, getting information from customers, and monitoring it in the tracking tool is vital for maintaining customer satisfaction. The Gantt Chart and Calendar are two examples of project management tools that can be very useful when using this development process.
The Gantt Chart and Calendar are tools designed to track the progress of a project. These side-by-side tools facilitate the visualization and management of large projects by displaying all of the tasks involved. Whether you’re supporting an upcoming project or just want to track personal goals, these time management tools can help. Basically, calendars and Gantt charts both are essentially planning tools: they help you organize data and manage projects by tracking milestones, tasks, and deadlines.
What Is The Difference Between A Gantt Chart And A Calendar?
Gantt charts and project calendars have similar functionality, though their looks clearly differ. Still, you may have wondered about the differences in detail and the possibilities for replacing one for the other. Calendars and Gantt charts look a bit different, which naturally leads to usability differences as well. Gantt charts are less intuitive so using one can create extra work in getting a team up-to-speed. Long story short: These different project planning tools are helpful in different ways. If you’re looking to cover all your bases, I recommend using both of these project management tools.
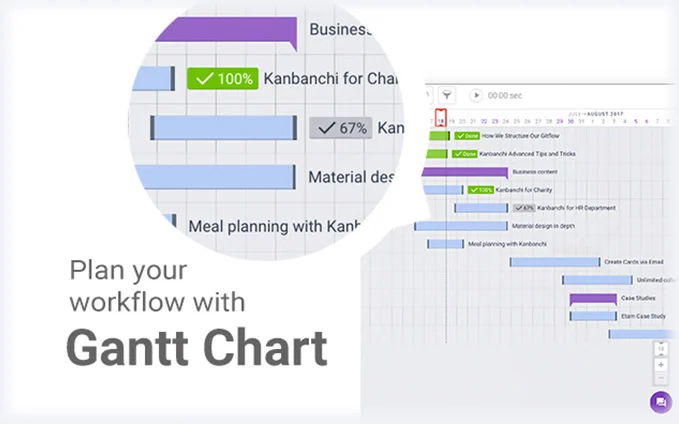
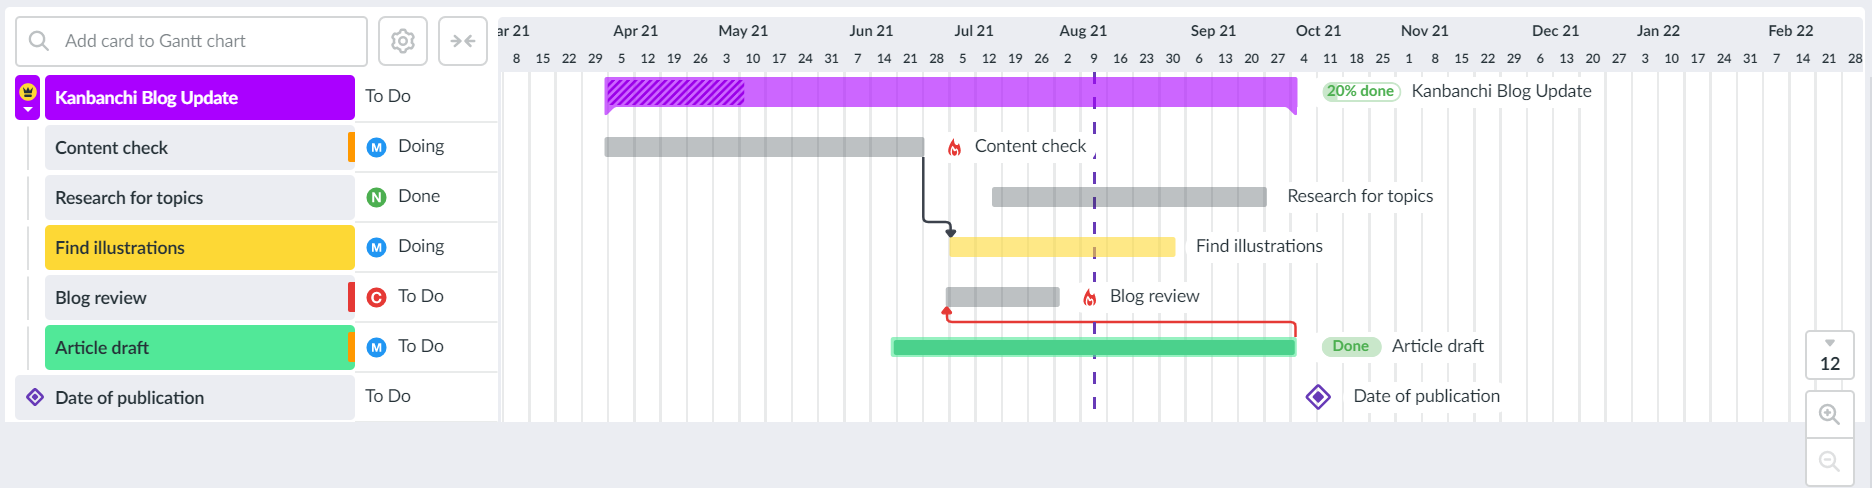
Kanbanchi is an online project management tool that makes it easy for everyone to get on the same page — from planning and scheduling projects to sharing important business documents like calendars and Gantt charts. It is a straightforward and simple-to-use app with a Gantt chart. It was designed from the ground up for ease of use. Create your tasks and record their durations by dragging them into the Gantt chart. Kanbanchi will organize all of your tasks for you, coloring them as per their status and making sure you can easily see what needs attention.
Kanbanchi helps you manage your projects of any kind. It is simple, easy to get started, and a great way to track your everyday tasks too! It comes with a friendly user interface that allows you to drag and drop tasks according to the process you created in the software. This is great for planning for longer projects.
The Kanban board is a workflow tool that originated in Japan. Its name is the Japanese original of Kanban (看板) to “signboard”. Firstly, it appeared in the 1940s. Taiichi Ohno brought these boards to the Toyota factory as a way to make their processes more efficient and productive.
The Kanban method works neatly with a Lean management approach. Moreover, it gives benefits such as increased productivity and low amounts of waste during manufacturing processes. Above all, it has also been used successfully in other industries, such as software development.
How Does a Kanban Board Work?
These boards provide simple visual representations of the workflow and are very easy to understand. They often include just three columns. To clarify, they show the categories: “to do”, “doing” and “done”, or some variation of these names.
The process adapts to different teams and industries by adding or changing columns to fit their exact needs. The workflow can then be tracked by managers and anyone else in the team. No matter how big or small the team is and what they do, this gives an at-a-glance summary of how the work is flowing.
The days of relying on sticky notes on whiteboards are long gone for most companies, who have now moved on to using an online Kanban board that lets them manage their workflow more efficiently and introduce this methodology to their remote teams.
The Kanbanchi software ties in perfectly with Google Workspace to provide a comprehensive project management tool that you enter using your Google password. By putting a Kanban board, Gantt chart and time tracker in one place, this application lets you manage all of your tasks and projects together.
There is no need to install any software, as the tool sits in your device’s browser. It integrates with Workspace. You can use the board with Google Drive, Calendar, email and the other Google tools that you use on a daily basis.
6. What is the difference between a Gantt chart and a roadmap?
Aren’t Gantt charts and roadmaps just different ways of viewing the same thing? Both tools display information related to finishing a long-term project, such as developing a product. Both tools also set milestones for different parts of the task after some time. But our answer to this common question is a reasonable No: Gantt charts and roadmaps are different tools with totally different purposes.
What is a Gantt chart? Definition & meaning
A Gantt chart is a bar diagram that shows tasks schedules related to a particular project. It was invented by the American consultant Henry Gantt.
A Gantt chart is well-known for the following basics:
There is a list of tasks and subtasks in the left column
It contains a header that displays time units
It also includes bars on a timeline that contain tasks.
With the help of the chart, project teams can understand the required work and the order in which the tasks should be completed. The chart allows visualizing a project’s start and finish dates and the start and endpoints of every task, people assigned to particular tasks, task dependencies, project milestones, and deadlines.
Where do we use a Gantt chart?
Gantt chart looks helpful in:
IT project management
Web design
Construction
Marketing
Retail
Education
Healthcare
Business planning
Event planning
Consulting
What is a Gantt chart tool?
62% of respondents believe that project work will increase in the future, according to the annual Wellingtone report. It means that the popularity of professional project management and planning tools will also grow.
In this case, online project management tools like Kanbanchi will grow in use. Kanbanchi is a project management and team collaboration tool made specifically for Google Workspace users that provides Gantt Chart and Kanban tool in one app. Kanbanchi integrates with Google immediately after you sign up with your account.
What is a roadmap? Definition & meaning
A roadmap is a planning tool for keeping all participants of the project updated. It is designed with the help of a Gantt chart, and most roadmap tools are based on the Gantt Chart. A product/project roadmap represents the outlined goals with the required steps. Using a handy bar diagram for road mapping, you can set up a plan detailing how the team will complete it. A well-developed roadmap reflects the product strategy.
Where do we use a roadmap?
Roadmaps are used in different industries, from IT to finance. It will help you to:
Start a project on time
Meet stakeholder expectations
Share the progress of your project
Split a team and stakeholders
Create a foundation for a future project plan
What is a roadmap tool?
An online roadmap tool enables companies to manage their product/project life cycles and communicate the strategy and goals to management, team, and all stakeholders. A roadmap and a Gantt chart both have advantages and disadvantages. They can work together to help you empower your plan’s strategic elements and execute that plan most effectively.
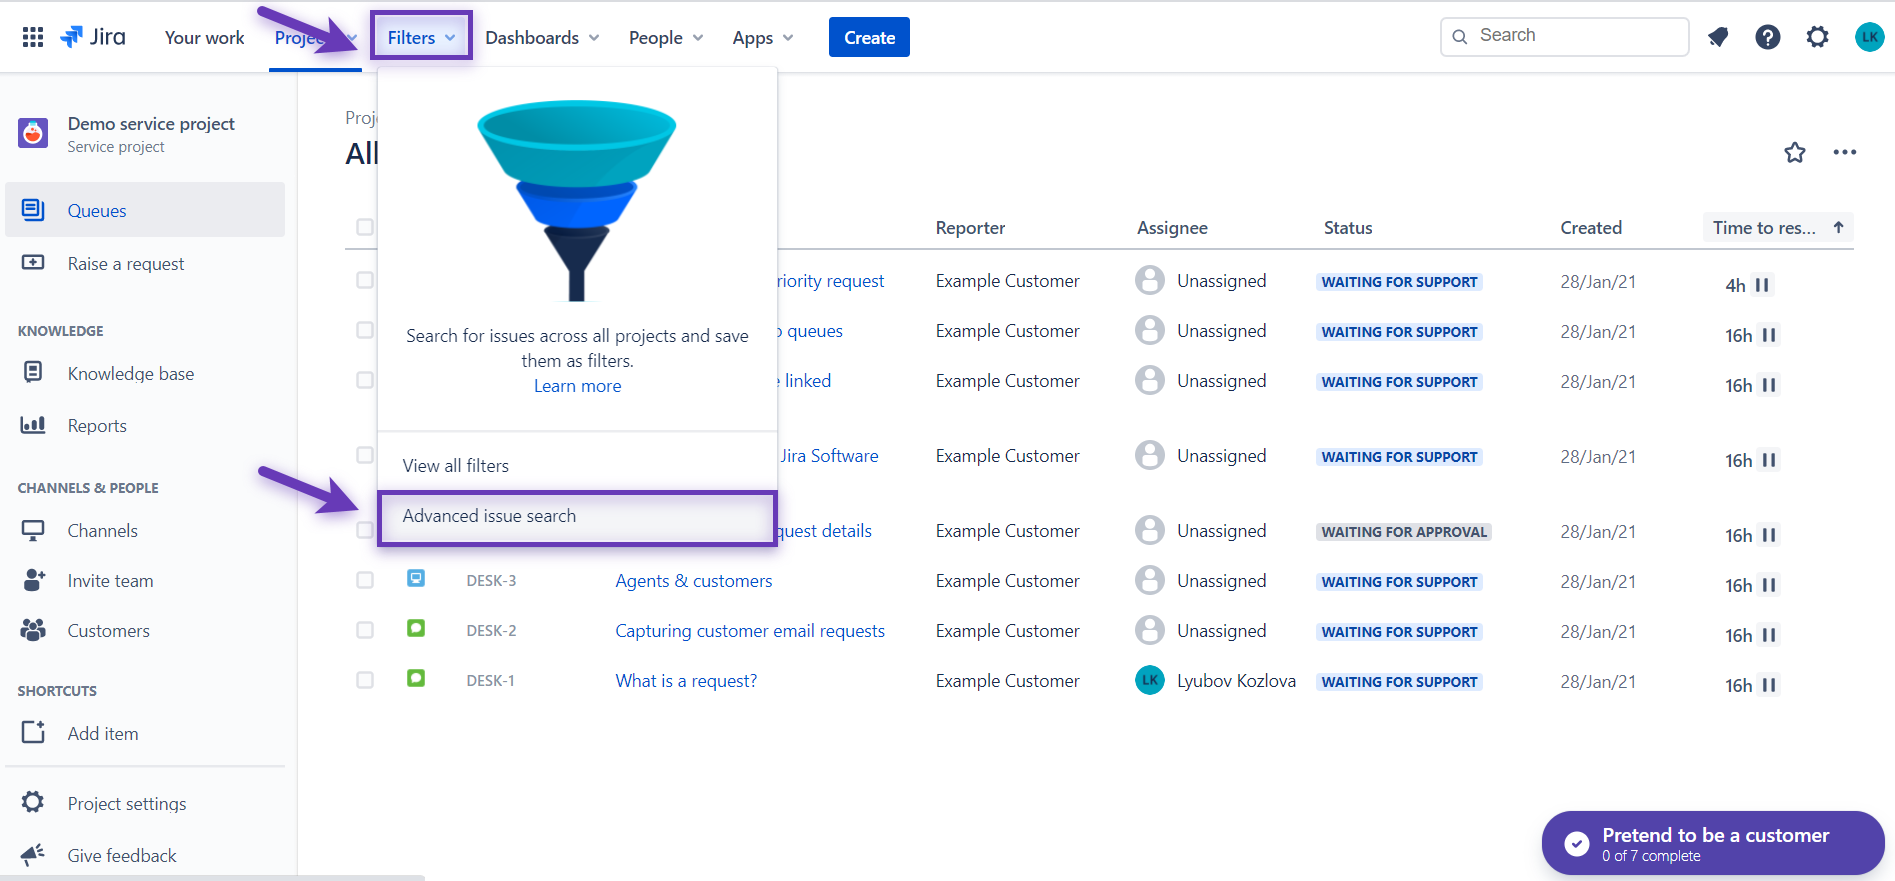
7. Does Google have a task manager inside Google Workspace?
Companies and individuals worldwide use Google apps. Google Workspace is one of the most popular and powerful office suites. With apps like Google Drive for file sharing, Forms to collect information, Docs and Sheets for making notes and sharing across the team, and Google Meet that allows you to instantly connect people from different locations, Google Workspace is irreplaceable for many companies. However, there's no task manager inside Google Workspace.
So, what do I do if I need a task manager inside Google Workspace?
If we analyze the search requests on Google, we will see that people frequently look for “Google Workspace task manager”. However, there's no such solution built by Google.
The best way would be to use an app that has a deep level of integration so that you can't feel the gap. Kanbanchi is built for Google Workspace users by Google users. It is a project management and task management solution integrated into the familiar Google ecosystem.
Do people search for a particular tool?
The whole idea is probably not to have something made by Google but rather to find a tool that has the same behavior patterns as Google Workspace. It won't require additional time to educate people on how to use another system.
Kanbanchi lives and works inside your Google Drive; it's integrated with Google Calendar, Forms, Sheets, and its usage can be controlled by Google Workspace admins. Project boards that you create in Kanbanchi act like files inside your Google Drive and can be easily shared with your colleagues. It eliminates any learning curve and makes knowledge sharing quick and easy.
Many Google users try to track tasks in spreadsheets and with emails. Sometimes the information gets lost through emails and spreadsheets become too long to read. At this point, you might come to the need of having a Kanban board or a Gantt chart. These tools will help you to visualize your projects and track tasks. Kanbanchi has both of them under one subscription. So, you won't be paying for a Kanban board and a Gantt chart separately.
8. What Is The Difference Between A Gantt Chart And A Timeline?
The Gantt Chart and the Timeline are two project management tools that often get confused for one another. Both the Gantt Chart and Timeline provide a general overview of how a project will be completed through their use of connected bars, tasks, milestones, and dates. However, there are some distinct differences between Gantt Charts vs Timelines. Those differences will determine which tool is best for you.
Like Gantt charts and timelines, both tools help project managers track their projects so that they will know how much time it will take and what to expect along the way. In order to understand the difference between a Gantt chart vs timeline, it is essential to first understand what they are.
What Are Gantt Chart And Timeline Tools?
Gantt charts and timelines are similar-looking project planning tools with a few differences. You can think of them as the “left brain” and “right brain” of your project management template arsenal. Gantt charts organize your tasks and manage time, while timelines tell the story of your project.
Gantt charts and timelines help you visualize project plans, task workflows, and deliverables. A timeline will offer a way of visualizing the resources needed for your project, as well as tasks linked to milestones and deadlines, providing what-if scenarios. A Gantt chart is great for mapping out the activities of your project in chronological order - from start to finish. It’s also useful for showing dependencies between various task activities: if one task is behind schedule, it can affect subsequent ones too.
A timeline can be used to visualize the project roadmap, completed tasks, and events. It is very easy to generate a visual task flow overview with a timeline. This can help you get a sense of which projects are delayed, when they are due, or if they take too much time. A Gantt chart is a 2-dimensional chart of a sequence of tasks and its dependencies shown in the form of columns within rows. It is essential in some environments - especially in military projects where the management has to rescue "at risk" or failing projects.
What Is The Difference Between A Gantt Chart And A Timeline?
A Gantt chart shows the inter-dependency of the tasks involved in a project along with their start and end dates. A timeline is simpler – it just visualizes events on a single line, but it does so at a glance to make sure nothing overlaps or falls behind schedule. A timeline also helps you get an overview of your projects, past, current, and future. Meanwhile, a Gantt chart helps you manage your projects by displaying tasks, durations, and progress visually.
Above all, timelines offer a lower-level overview of a project’s start, end, and important milestones. They are a simple way to track what needs to happen when. Gantt charts provide a high-level overview of a project’s start, end, and important milestones. They break up the big picture into small chunks that can be easily digested.
Kanbanchi app offers a Gantt chart for project managers with all the features they might need. Kanbanchi's Gantt Charts are the best way to visualize tasks with their durations and then estimate how much time your project might take. This is great for planning for longer projects. With the Kanbanchi Gantt chart comes an easy-to-use info-graphic user interface that allows you to get started right away. All you need to do is drag and drop tasks and start the project.
Want to try the power of Kanbanchi and Google Workspace?
9. The Best Trello Alternative for Google Workspace in 2026
Do you find that project management can be a struggle when using Google Workspace in your business?
Project management tools are needed more than ever in 2026, especially for teams using Google Workspace and looking for enhanced ways to collaborate and organize work more easily.
You may have ended up with Trello as your main project management tool by default — but did you know that comprehensive alternatives that integrate more fully with Google Workspace than Trello are available?
One of the best Google Workspace Trello alternatives is Kanbanchi, which provides enhanced integration with Google, better customer support, more robust reporting, and increased security when compared with Trello.
Let’s look closer at the Trello and Kanbanchi project management solutions with a side-by-side comparison to help you determine which option best suits your business.
What Is Trello and How Is It Used in Google Workspace?
Trello is a popular cloud-based collaboration tool that enables users to organize projects and everything related to them into a series of “boards”, “cards”, and “lists”.
The Trello concept is based on the Kanban “lean management” system, which is a visual workflow management method developed in Japan primarily to visualize workflow and identify bottlenecks.
By using Trello, businesses can separate work into different projects, allocate tasks to an individual or groups of individuals within the business, and instantly check progress on each project. All related items can be seen on one page, offering a simple but complete project overview.
Screenshot of Trello's Product Roadmap Template
Access to each board and card can be closely controlled by administrators, with each projectfurther broken down into subtasks and checklists detailing specific jobs for different individuals. Tasks may have deadlines assigned and notifications can be sent to users when action is required on a task allocated to them. Activity logs keep the entire team up to date with progress.
With Trello, users can attach and share files and use a built-in automation tool called “Butler”. Another feature of Trello is its integrations with power-ups, including Slack, GitHub, Telegram, and Salesforce, as well as Google Drive. Power-ups are like plug-ins that enhance functionality and add customization to Trello.
Trello Power-Ups are app-like extensions that add extra features and functionality to your boards
Trello is designed for use on the go with a simple interface. Most of its features are free for businesses upon signing up, though a premium option is also available, as well as a fully functional mobile app.
Many small and medium-sized businesses use Trello to integrate with Google services, allowing teams to explore the cloud storage and online sharing capabilities of the Workspace applications while still working in Trello. This generally works well when configured correctly but users must investigate how power-ups work and set them up correctly to make the most of the integration.
Some integrations are “clunky” when compared to other Trello alternatives for Google Workspace. For instance, Trello users can attach files directly from Google Drive but these files remain as static links, meaning that the link content remains the same unless manually updated.
More Trello-Google Drive integration issues are examined in the next section.
Why Trello Is Not the Best Option for Google Workspace?
Businesses looking to make workflows more efficient often seek Trello alternatives for Google Workspace — but why?
Well, Trello is promoted as being fully integrated with Google Drive but, as we shall see, the integration is far from seamless.
Users should be aware of the following potential issues with Trello’s Google integration when planning workflows or evaluating if the software is still the right fit for Google Workspace users in the business.
No Deep Calendar Integration
You can’t drag-and-drop Google Calendar events into Trello or sync multiple calendars natively. This makes the system rather clunky when relying on these calendars for complex scheduling, potentially leading to missed meetings or appointments.
Time zone discrepancies between Trello and Google Calendar can also lead to inconsistencies in scheduling.
Some users also find that there are insufficient calendar customization options, further reducing its effectiveness, while authorization issues and problems with expired authentication tokens exacerbate the problems.
Syncing calendars across all devices is particularly problematic if you’re using outdated versions of the Trello app on your phone. It may take 24 hours for the updated information in Google Calendar to be synced in Trello.
Difficulties with Syncing Files, Attachments, and Authorization
Syncing files and attachments between Google Drive and Trello cards can be a challenge for users.
The Google Drive power-up allows users to attach files directly from Drive and set file permissions but, as mentioned above, the Drive files remain as static links. Links sometimes break if files are moved or deleted, adding extra work for collaborators.
When attached files are not shared properly, there may also be permission errors. Trello users signed into multiple Google accounts may also experience authorization problems.
Users may also receive "This app is blocked" errors due to Google's security settings, particularly in corporate environments where administrators restrict access to third-party apps.
Gmail Integration Issues
Trello allows users to convert emails into Trello cards directly from Gmail. However, the power-up may fail to load due to browser extensions or script blockers.
The integration also lacks two-way synchronization, meaning that updates in Trello are not reflected in Gmail. Nor does it support automatic data transformation, so manual editing is needed to clean and format email content before adding it to Trello cards.
Email-to-card formatting is sometimes inconsistent too, especially with long threads or attachments.
SSO Issues
Trello offers SSO (Single Sign-On) features but users report SSO errors due to misconfigured settings, as well as conflicts between personal and organizational Google accounts during integration setup.
Google Chat Integration Problems
Some users experience difficulties with Trello actions not reflecting in Google Chat. Even if the correct setup is configured, actions taken in Trello may not appear in the chat, indicating potential issues with the integration's functionality.
Workflow Limitations
Some users have noted that integrating multiple Trello boards with Google Workspace can be tedious, especially when managing several workspaces. So, while Trello offers a simple solution for managing standard projects, complex project management may require more advanced tools.
So, Does Google Have Anything Like Trello?
Since its launch in 2011, Trello has been adopted by millions of users. It is regarded as one of the pioneers of popularizing the Kanban approach to workflow management many years ago, inspiring many of its competitors.
But as more businesses have adopted Google Workspace to run their operations over the years, more Trello integration problems have been reported.
Users experiencing problems may wonder whether there is a Google version of Trello. After all, Google positions its products as everything needed to get anything done.
Google has no Trello alternative baked into it, even after recent changes in how its products integrate. So, the project management side of running a small or medium-sized business requires additional tools to boost productivity.
However, business owners shouldn’t become despondent. The good news is that there are lots of alternative Kanban tools available today. The bad news is that only a small fraction of them really integrate well with Google Workspace.
What Is Kanbanchi?
Kanbanchi is a Trello equivalent for Google, specifically designed with Google Workspace in mind.
The Kanbanchi visual team collaboration and task management tool started life in 2014 and has been purposely shaped to give small and medium businesses, tech companies, and startups more control over their project processes within the Google Workspace environment.
The native Google focus is an important difference from almost all other Kanban-based project management solutions, including Trello.
So, the first thing you notice is that Kanbanchi integrates with Google Workspace immediately after signing up — seamlessly and smoothly. There are no snags with power-ups, plug-ins or add-ons.
What is Kanbanchi Used For?
The Kanbanchi app primarily helps businesses coordinate remote work, manage projects, and remain agile within a Google Workspace environment:
Coordinating remote work: Remote teams can plan projects, coordinate work from anywhere, connect, and keep up with their tasks.
Project management: Manage and track projects with an automated, centralized, easy-to-use project management tool.
Agile management: Manage agile projects efficiently while collaborating in real-time on the requirements, scope, and progress of projects.
Individuals and teams using Google can create, assign, schedule, and track multiple tasks and projects to help organize work in one tool.
With a seamless Google Workspace integration, you can attach and share documents, spreadsheets, and more with teammates from Google Drive. A fully synced calendar also means that no meetings or deadlines are missed.
You can even save and edit your boards as files in Google Drive, with flexible access permissions for colleagues.
Who is Kanbanchi For?
Kanbanchi is most often used by:
Small and medium-sized teams
Midsize businesses
Freelancers
Some larger enterprises
Booking.com, National Institute for Health and Care Research, eBay, Rosetta Stone, Costco Wholesale, lastminute.com, ArtiKen, and Etam France are a few of the household names that use Kanbanchi.
Kanbanchi's main strengths
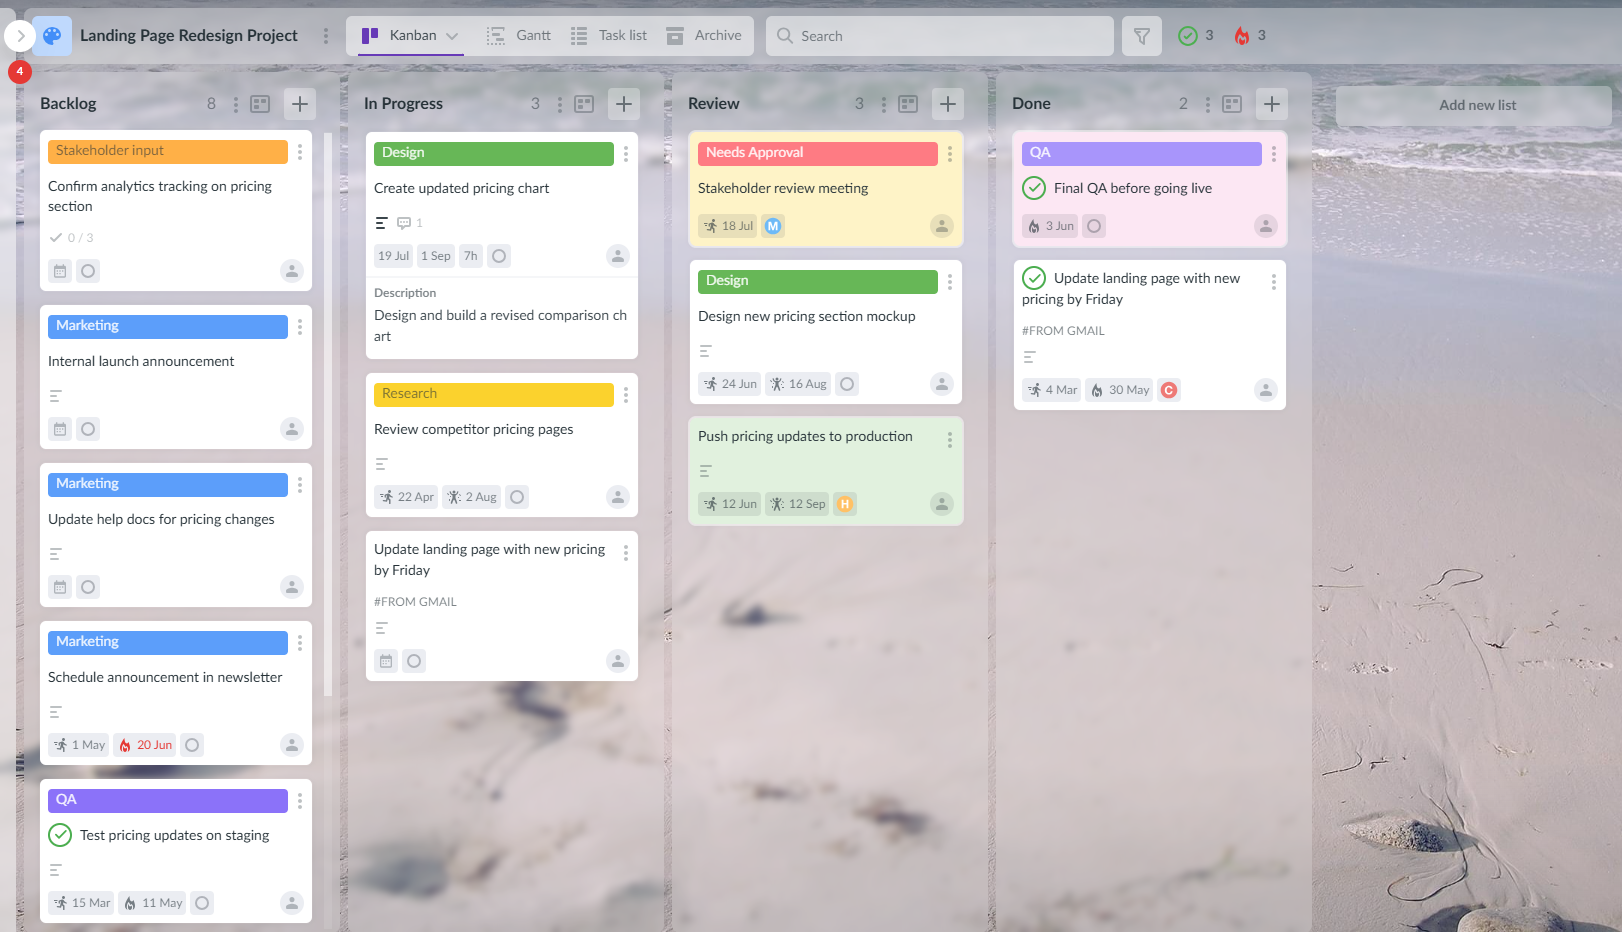
Easy-to-Use Kanban Project Boards
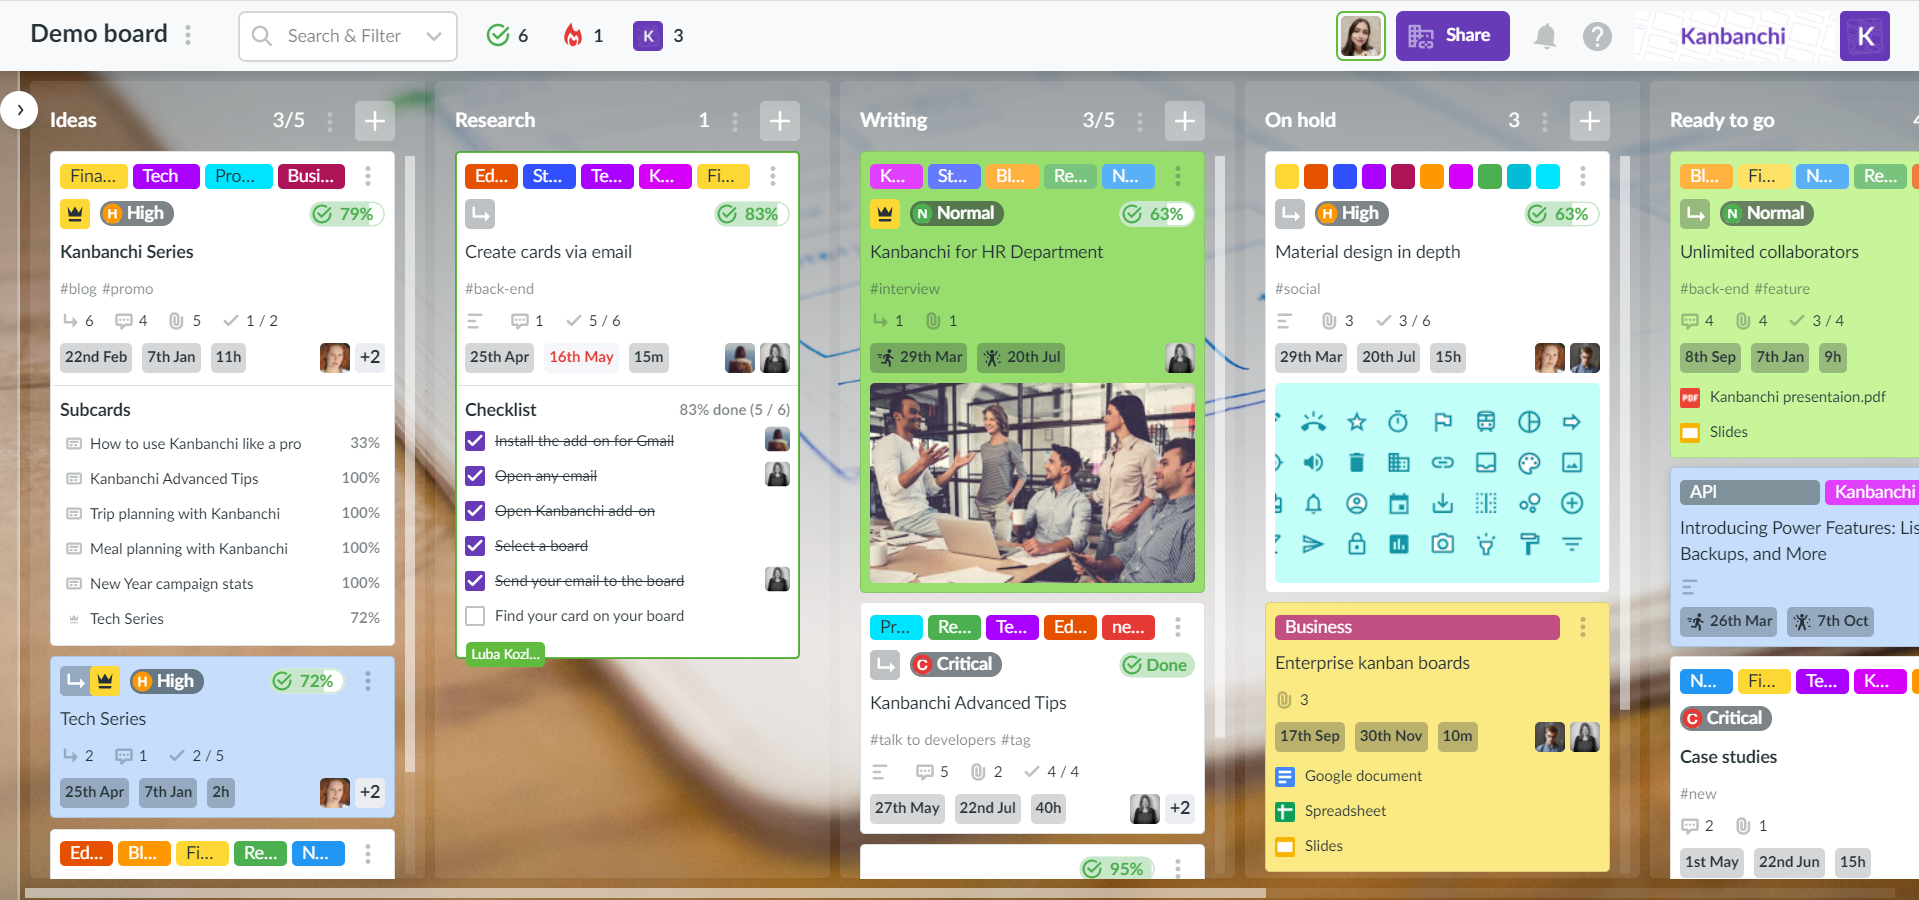
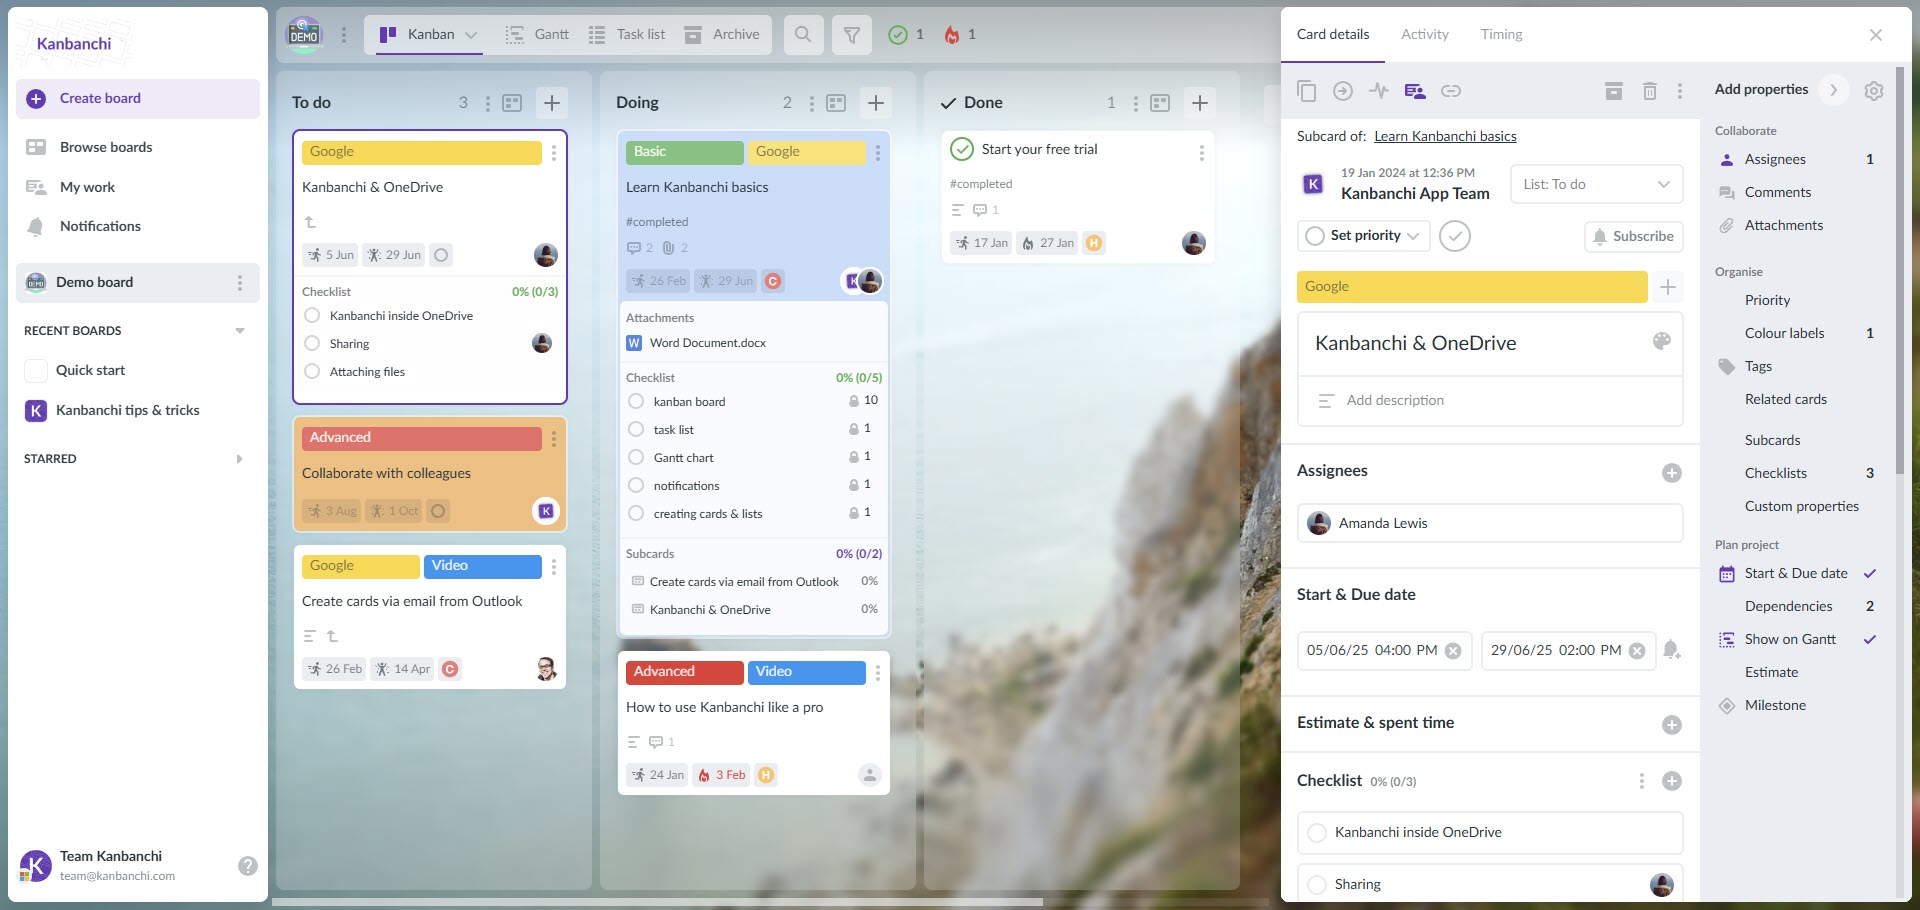
Kanbanchi provides unlimited project boards with a simple user interface, allowing Google Workspace users to easily visualize tasks as cards, prioritize important tasks, and collaborate with team members in real time.
Small and medium-sized teams can create lists that represent work categories or stages in the Google project management workflow, organizing all ongoing tasks and projects.
Multiple Work Views Including Gantt Charts
Besides the Kanban board view, Kanbanchi allows users to switch views. The List View displays cards in a scrollable list and lets users go through them quickly from top to bottom, while the Archive view and Team Workload View are other options.
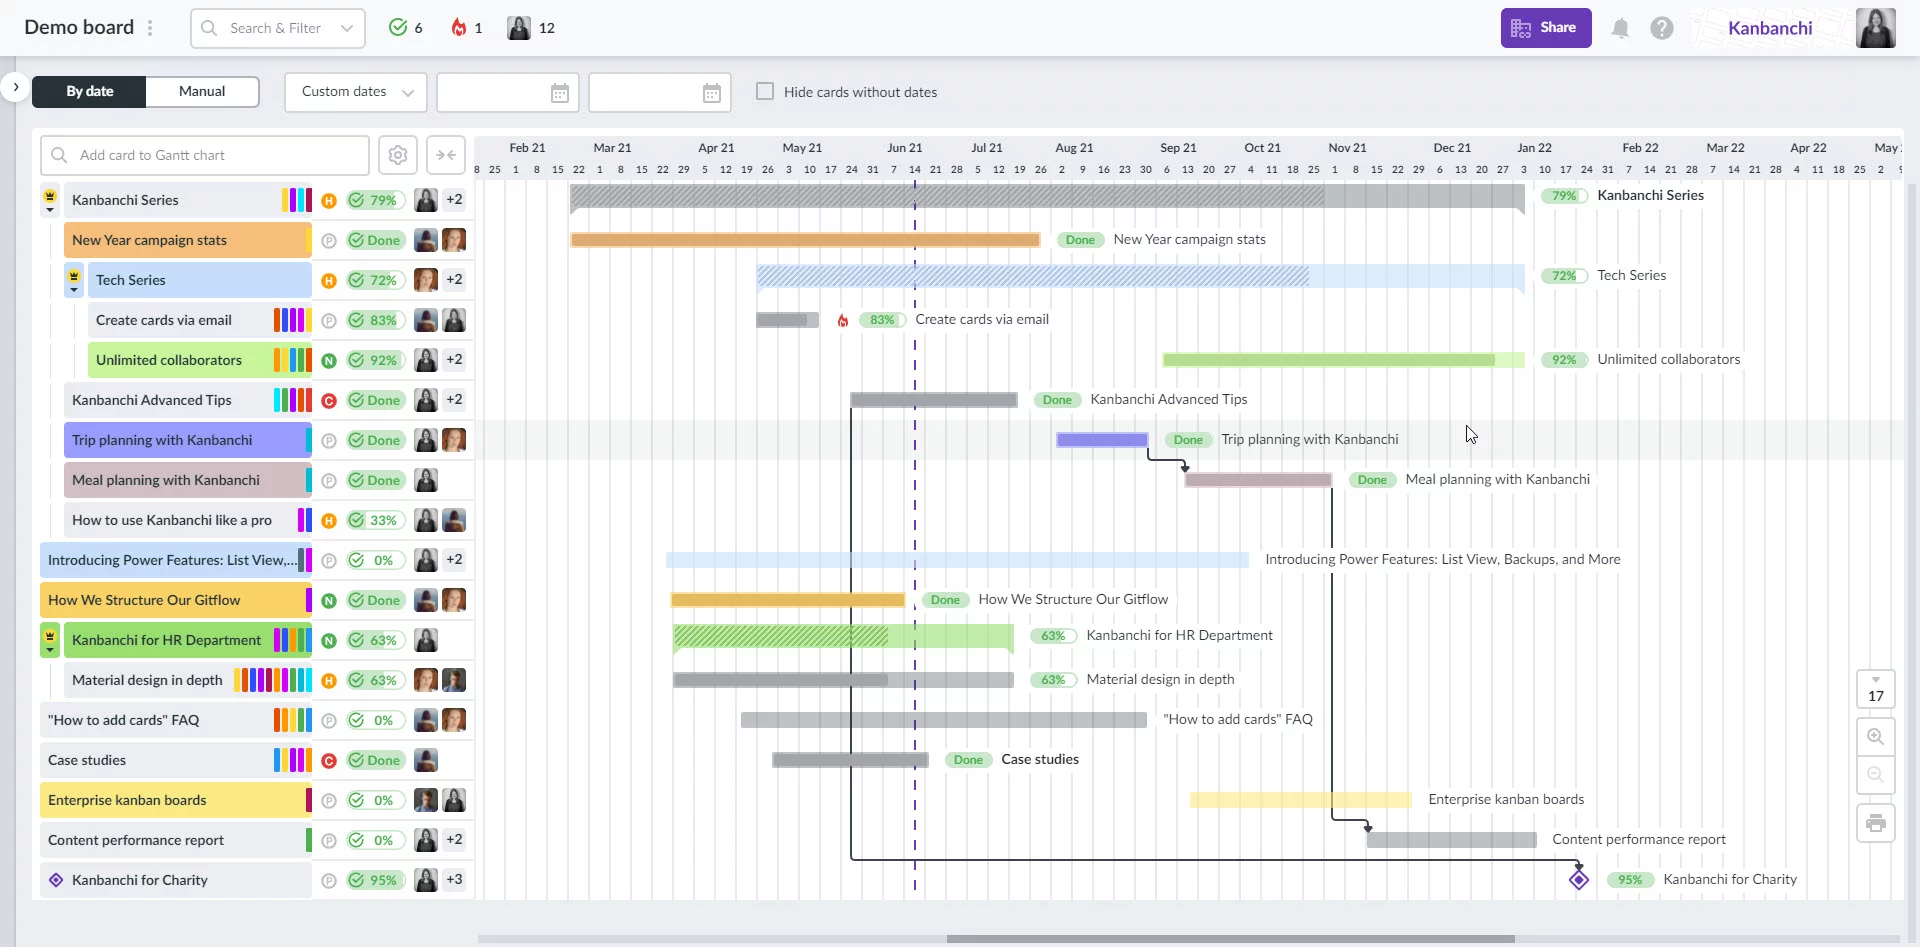
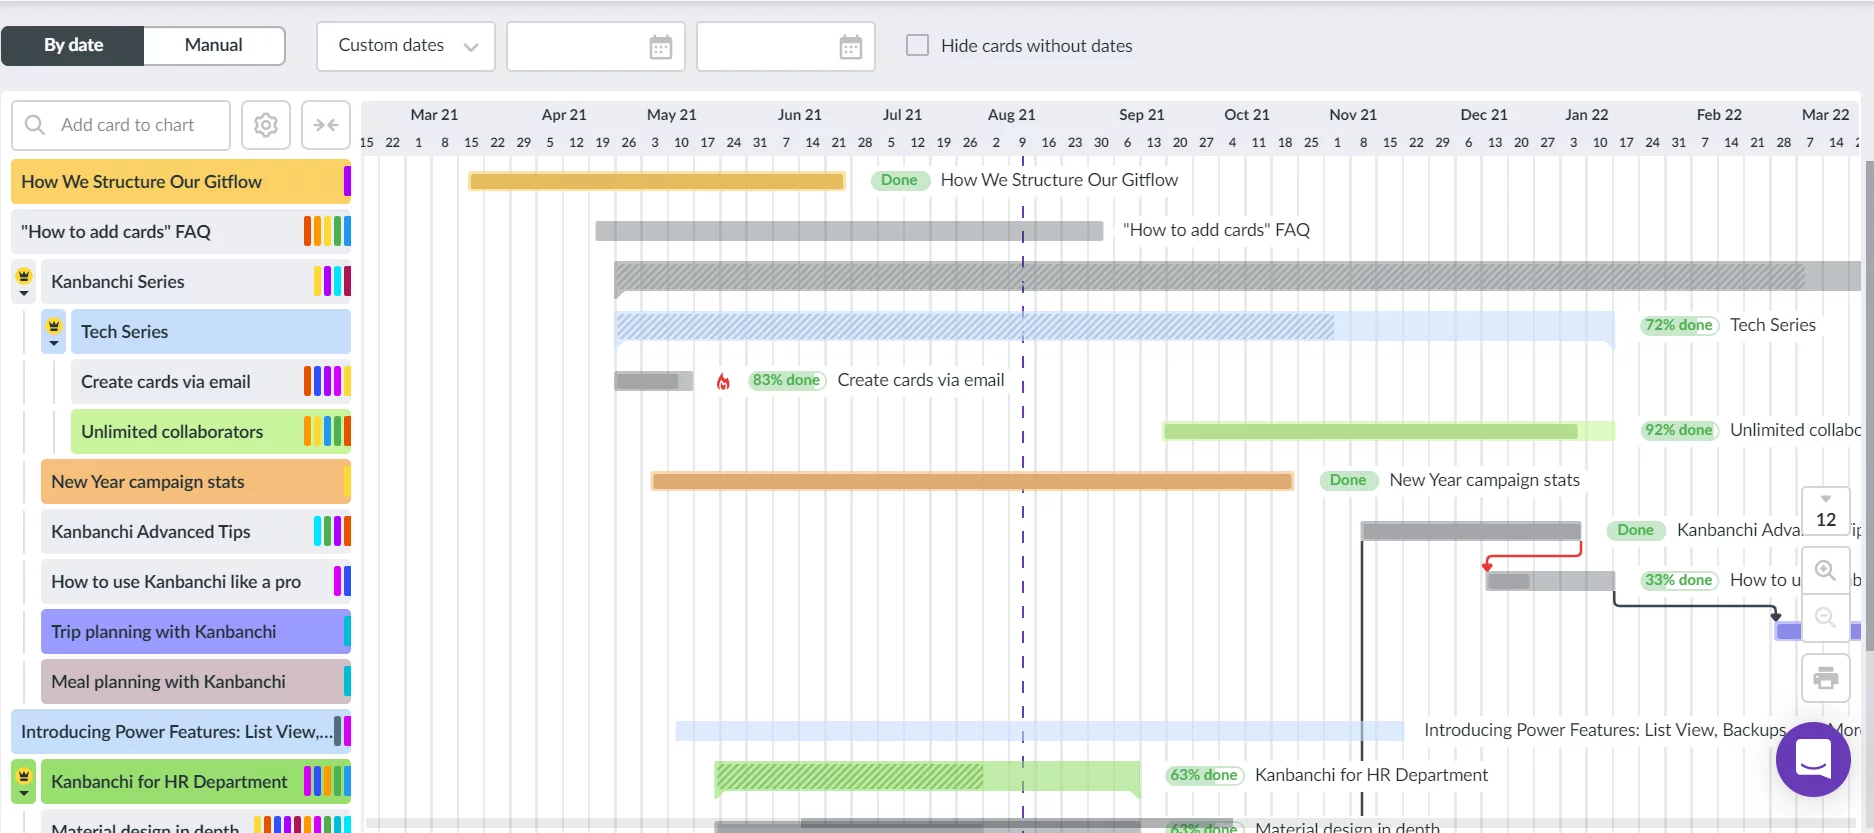
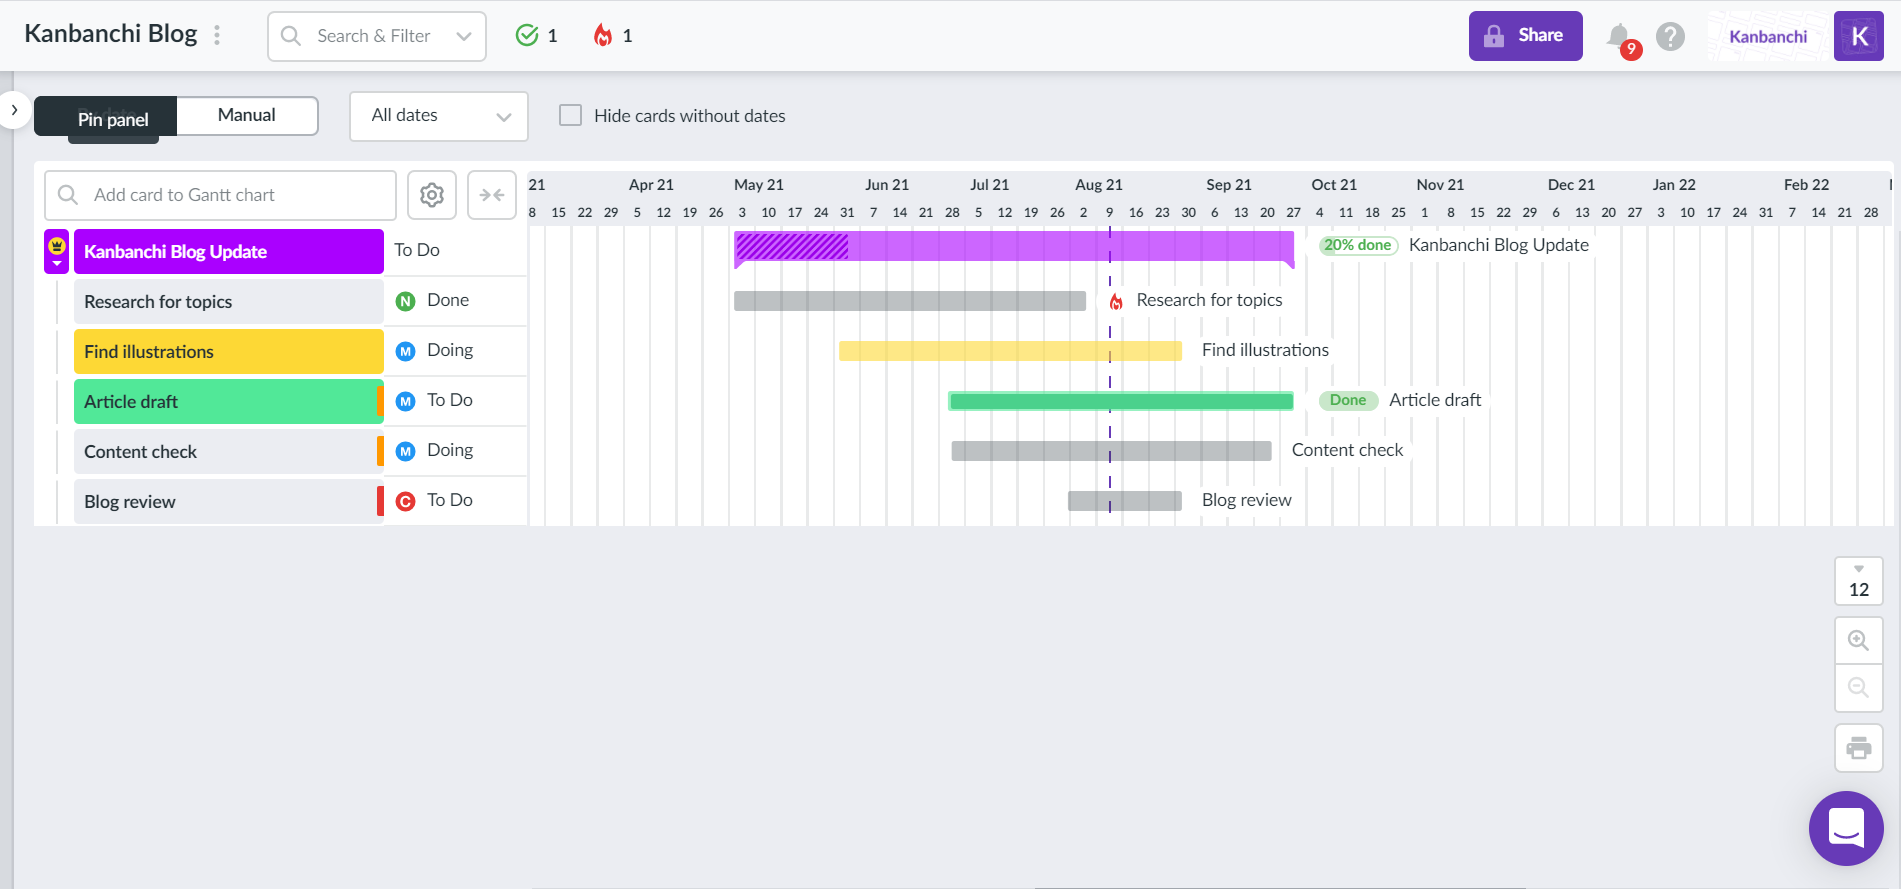
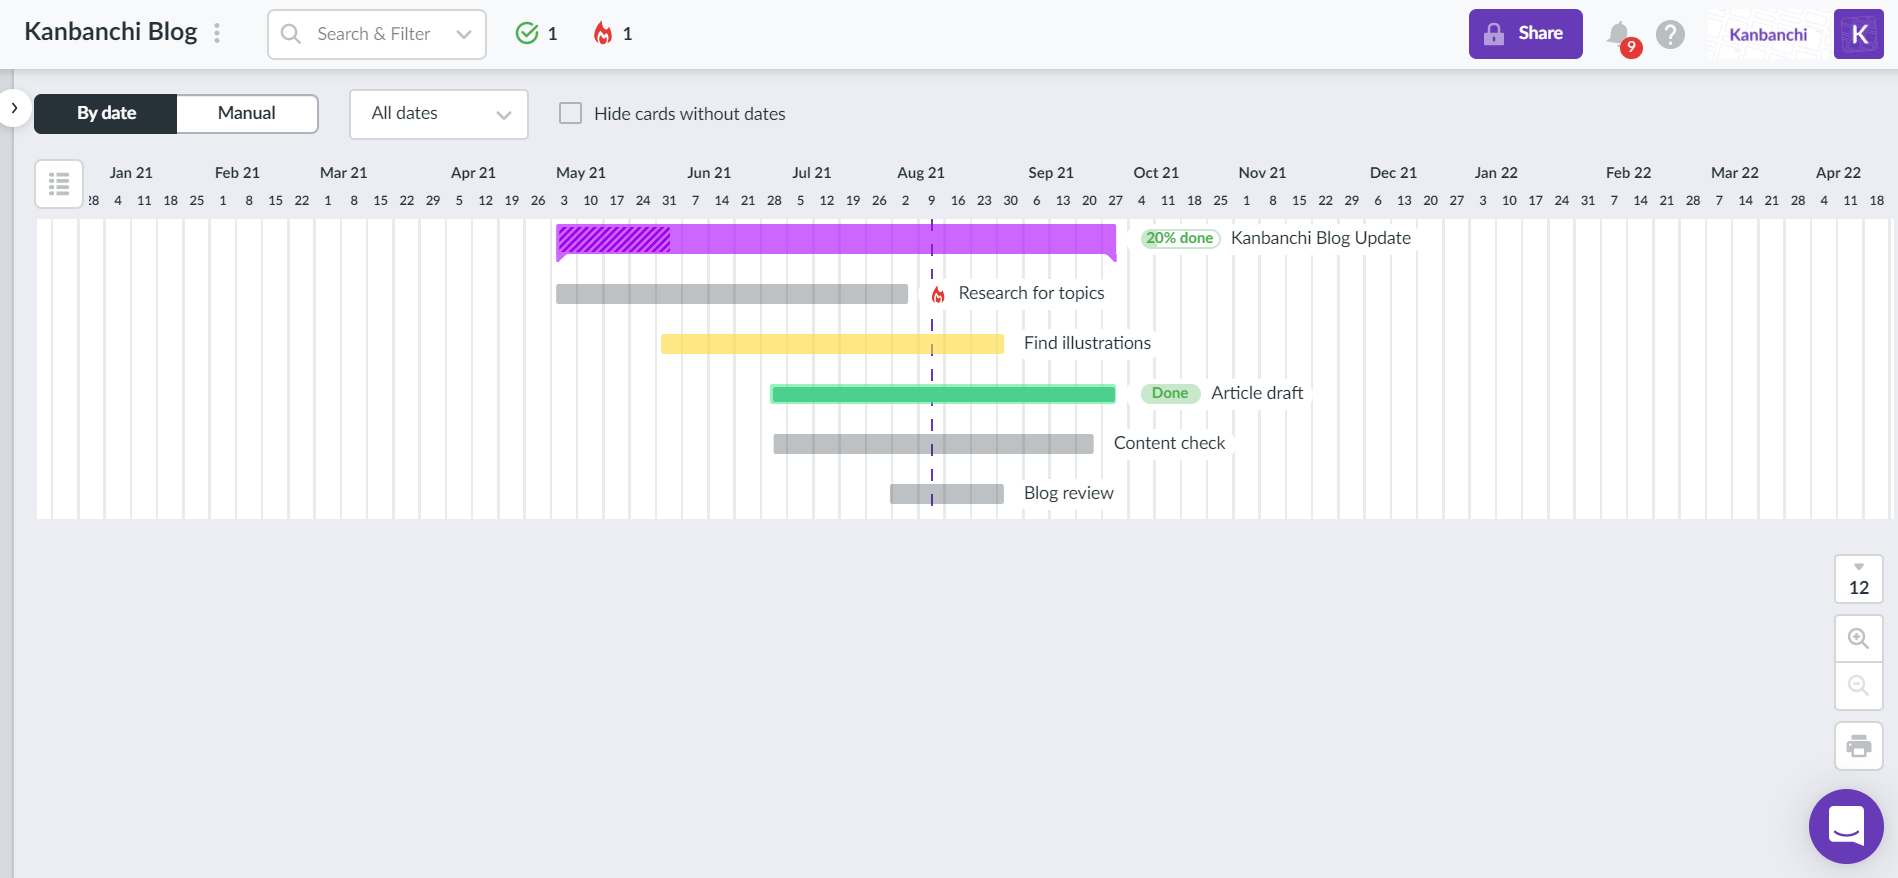
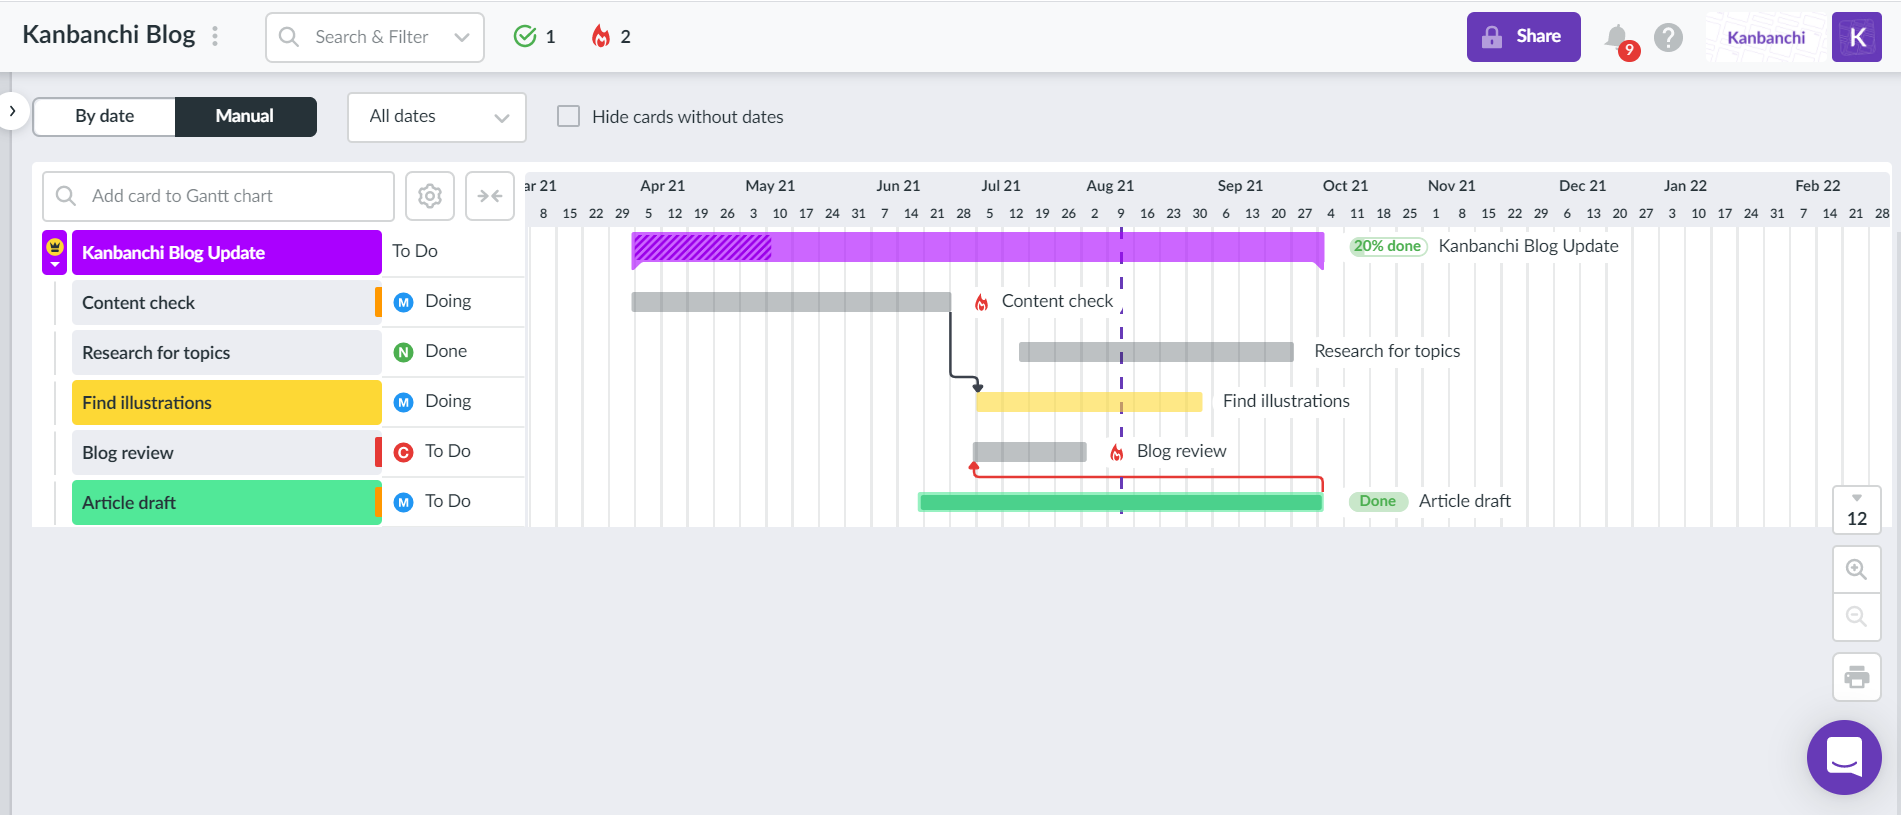
All Kanban boards in Kanbanchi may be converted to a Gantt Chart in one click, displaying the cards in relation to time. Users can see the duration of each card across a timeline, allowing the dynamic adjustment of schedules.
To adjust schedules on the Gantt Chart View, simply drag the edge of the bar. The Kanban board will reflect all the changes you make on the Gantt chart and vice versa.
Native Google Workspace Integration and Interface
Kanbanchi lets users sign up and sign in with their Google account. Google Workspace users can edit Kanbanchi project boards from within Google Drive as files and set access permissions.
Users can also push dates and view them on Google Calendar, create boards from Shared Drives, and connect their Gmail inbox to boards.
Security
For teams extensively using Google Workspace, documents and digital assets may be stored in Google Drive. It may not be secure to upload them to a third-party project management app for quick access from a project board. Kanbanchi eliminates this problem because all files stay in your Google Drive while remaining connected to the project boards.
Easy to share
Sharing boards and files is easy with Kanbanchi’s native Google Drive integration.
You can share boards with your colleagues within the corporate Google Drive, providing an easy and fast way to collaborate. Once you set up a board for your project, you can share it with one click to collaborate on tasks in real-time.
Easy to track time
For Google task management, you can track time directly in Kanbanchi. Simply choose a card, start the timer, and monitor your team's progress in the Timing tab, where all user timing data is recorded.
Customization options
Since Kanbanchi’s release, regular updates have offered more customization options. Custom properties such as text, numbers, and dates can be added to all cards on a board, enabling you to manage different projects without switching between tools.
Users can also customize Kanbanchi's appearance by adding the company logo and custom background image — especially useful if you work with clients through the Kanbanchi platform.
Customer Service
Bored with being ignored when you run into a Google Workspace integration issue? The Kanbanchi team adopts a different approach to customer service and takes pride in its response times to queries.
Why Is Kanbanchi the Best Tool for Google Workspace?
Kanbanchi not only integrates with Google. It was purpose-built that way. The tool directly addresses the lack of an integrated project and task management tool within Google Workspace.
Trello comes close, but it was not designed for Google users, like Kanbanchi is. This native integration sets Kanbanchi apart and makes it the best Trello alternative for Google Workspace.
Kanbanchi essentially becomes part of a business’s corporate Google Drive and Shared Drives. It is as easy to use as the Google apps we know and love.
Highly rated on theGoogle Workspace Marketplace, here’s a summary of the main benefits of Kanbanchi’s deep and seamless integration with Google:
Seamless Google Drive integration: Helps you collaborate on tasks with colleagues and easily share files with them.
Highly secure: Boards are encrypted, passwords cannot be lost (because Kanbanchi uses Google account authentication), and all files are stored on YOUR Google Drive.
Simple card organization system: Automatic sorting and filtering options for users.
Full native synchronization with Google Calendar and Gmail: No power-ups needed.
Customizable: Corporate branding options are available with custom reporting for Google project tracking.
Easily exportable data: Board assignments, dates, checklists, and comments can all be exported directly to Google Spreadsheets.
Simplicity: Everything is ready to go “out of the box” with zero learning curve.
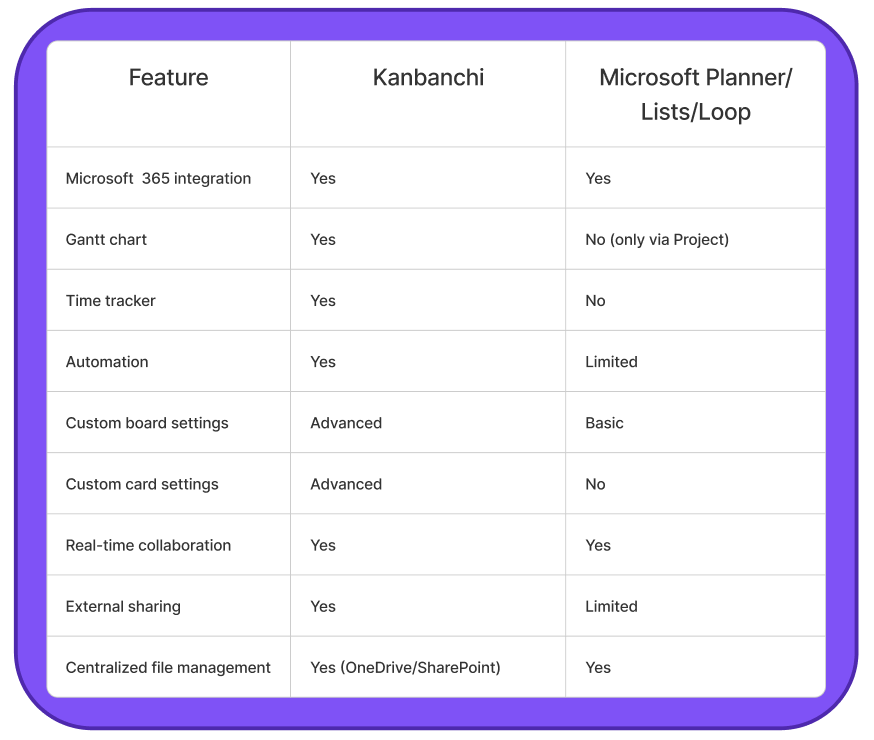
Kanbanchi and Trello Comparison Table (2026)
Both Kanbanchi and Trello help businesses to collaborate and organize internal workflow, but Kanbanchi’s key difference is that it natively integrates with Google Workspace. Here’s a side-by-side comparison:
TRELLO
KANBANCHI
Free plan
✅
✅
Ease of Setup
Setup with email or Google login; integration with Google Workspace requires additional Power-Ups or configuration.
Seamless setup for Google Workspace users — automatic sign-in with Google account, instant access to Drive; no extra configuration needed for Google-based teams.
Integration with Google Workspace
Requires additional settings for quality work with Google Workspace.
✅ Kanbanchi was originally designed to work with Google Workspace.
Ease of use
For a more comfortable work environment, you need to explore the hidden features.
Intuitive interface. No additional settings required.
Try Kanbanchi — The Best Trello Alternative for Google Workspace
Kanbanchi stands out as the best Trello alternative for Google Workspace users in 2026 due to its deep integration, seamless workflow, and user-friendly Kanban approach.
Kanbanchi offers Google users almost everything that Trello does, but with a deeper integration with the Google ecosystem and its apps. That’s why thousands of teams have upgraded to Kanbanchi since 2014.
There’s no learning curve with Kanbanchi. Simply deploy it to all your organization's users from the Google Admin Console.
You really can master the system in 15 minutes — and to make migration simple, you can even import your Trello Boards directly to Kanbanchi or import from CSV. Start with a free trial of Kanbanchi today…
10. Benefits of Project Boards and Why You Need One Now
Ordinary, a project manager spends a considerable amount of time on planning. Project boards can help to reduce the time spent, visualize the process and prioritize tasks. Haven't tried a project board yet? Well, it's high time to.
What does a project board do?
First of all, it is a multi-purpose space where you can track assignments across several projects and detect weak points. A project board is a tool that depicts the workflow visually and as a result, maximizes efficiency. Being a collaborative tool, a project board stimulates to discuss and analyze tasks. Consequently, it leads to improvements and strategy development.
Certainly, there are enough project board types to choose from. Therefore, organisations may pick a specific methodology to stick to.
Scrum boards – typically they depict a process in sprints.
Kanban boards – born in Japan, the term means a visual card with the focus to track the work in progress.
Visual Management/Task boards – provide a visual to support keeping track of the work. Tasks are presented as cards, just like a Kanban board. A basic layout can be To Do, Doing and Done.
Setting a project board up
Using a Kanban board as an example it is obvious that a project board setup doesn't need much effort. Kanban project boards primarily consist of lists and cards. Often lists represent project stages. For instance, the software development process might be split into Backlog, In work, Testing, Quality Assurance, Done.
Benefits of project boards
In fact, there are lots of arguments in favour of using a project board. Here are only a few of them:
Tasks visualization – all team members may track what they should fulfil and see the state of the overall work.
Comprehensive task description – the board displays not only the assignment but the level of its priority, how it is dependent on the other ones, when exactly it should be done, to which department it belongs and more.
Process automation – if you decide to build a project board in dedicated software you will rid yourself of a lot of manual work as the software will create recurring tasks for you, save successful layouts as templates and relocate tasks depending on their statuses.
Efficient task distribution – obviously, with a project board it is much easier to allocate tasks in accordance with an employee role and workload.
Helps to detect issues – probably, a project board will show you the issues you have no idea your project has.
Reports and strategy building – Being used as a reporting tool, a project board is an excellent way to communicate information to the stakeholders and decision-makers.
Why do you need a project board now?
With the help of a board, you may have an enhanced project management experience and open up new opportunities for your team. It presents an activity feed of what happens and when. Moreover, team members observe work in progress, while managers keep everything under control. By implementing, a project board you have more chances to drive a project to success.
11. Why “Google Workspace project management” is going to be among the search queries trends soon?
Google Workspace offers you a complete app pack for business. It is incredibly easy to install, maintain, and use. You are able to handle internal data organization, add storage, switch to another email address, access any other Google services, etc, all at once. So why “Google Workspace project management” is going to be among the search queries trends soon?
Can You Use Google Workspace To Manage Projects?
Project management tools help teams to collaborate and communicate more effectively. Whether you are working on personal or business projects, effective collaboration is now more important than ever before. It helps to build strong relationships with your team members and move your projects along efficiently. Especially if the people who are involved in your teamwork live in different countries, it will be much easier for them to interact with each other via Google apps rather than doing it face to face.
While there is a high demand for this tool, Google is offering its Workspace with no such project management tool. That is why “Google Workspace project management” is going to be among the search queries trends soon, as its users are in need of an app to manage their projects.
Does The App For Project Management Within Google Workspace Exist?
The lack of a project management app in Google Workspace is a big and obvious drawback, but luckily there is a solution. There are already many players on the market who have released their own project management apps that could be used to improve productivity in your team. Let’s see what is the alternative for Google Workspace users.
Kanbanchi is the easiest tool available to manage your tasks with Google Workspace. The user interface of Kanbanchi is highly responsive and comes with many features like Kanban board, Gantt Chart, Time Tracker, and Checklists. You can even attach files separately or sync them to your Google Drive.
It is a fast and easy-to-use project management tool, with a simple user interface and a lot of features. Kanbanchi helps you manage your tasks in a clear and visual way that is easier for you to prioritize them in the order of importance. Whether it is a small or large project, Kanbanchi always helps you visualize your project status. You can easily share projects, tasks with cards, and checklist with other users in the team.
Start your free trial with Kanbanchi today! You will see how easier it is to manage all of your ongoing projects at once with this tool.
Want to try the power of Kanbanchi and Google Workspace?
12. Google Workspace Project Management App Doesn’t Exist… Now What?
Google Workspace is a powerful pack of apps that are specifically designed to keep teams productive. It brings together the best collaboration, communication, and productivity tools from Google, all in one place. And its users need an easy way to set up project management. But Google Workspace has no project management app, even though the demand for this tool is high.
Alternatives For Project Managers That Use Google Workspace
For those users who have more complicated needs, Google services can not provide decent tools for project management. And while Google Workspace has no project management app, Kanbanchi steps in to fill the void by creating a project management tool for this purpose. It offers great tools features like Gantt Charts, Kanban Boards, Time Tracking, Analytics, and much more.
There are a lot of project management apps on the market. But few of them offer a single solution for all possible needs, from simple to complex projects that can be adjusted to any business workflow. And Kanbanchi can do all that.
Kanbanchi Perfectly Integrates With Google Workspace
Kanbanchi provides the needed integration with the other Google Workspace apps and services. You can install it using both a personal account and a company domain account. Kanbanchi perfectly integrates with tools like Google Calendar and Google Drive, which will help you to schedule tasks and share documents effortlessly. You can attach your Google files to the boards and cards so you won’t waste any time hunting around for documents or risk forgetting to grab them in order to complete a task. You can save time by working in a more collaborative environment - even when your team is out. This makes Google Workspace users' lives easier!
Have you ever heard of Gantt charts? I’m willing to bet that if you are reading this article then there is a good chance that you have heard of a Gantt chart before. Especially if you work in project management. Even so, I want to take a step back and remind everyone what the Gantt chart is, the benefits of using it, and how can a Gantt chart help with a project.
What Is A Gantt Chart?
Gantt chart is a visualization tool that a lot of project managers and businesses use to help them plan. It is a great way to visualize tasks, deadlines, and important resources and how everything comes together to achieve a goal. A Gantt chart is basically a bar or a column chart where the major activities of a project have been plotted in the form of vertical bars against time. It provides a clear picture of the future and helps in making better decisions accordingly.
Originally, the Gantt chart was created by Henry Laurence Gantt in the early 20th century as a way to make project management easier. This was important for bureaucratic businesses that had project managers to manage projects with strict rules about the procedures used. Meanwhile, today Gantt chart tools are occasionally used for large-scale planning but are primarily used for managing projects in small businesses and service sector organizations.
Benefits Of Using A Gantt Chart
Gantt charts offer an easy way to see how long tasks take and are required to complete a whole project. These tools also help to create realistic estimates by providing an overview of all tasks, dates, and deadlines involved in a certain project. They have been designed to make it easier to calculate time and cost while making the scheduling of projects more efficient.
Above all, Gantt charts are super easy to use. Of all the tools for project management in existence, Gantt charts are considered to be among the most popular. The way these charts work gives great advantages over other approaches to managing projects. In addition, you will see them used in project management and also in business plans when you need to demonstrate how a project will be completed.
How Can A Gantt Chart Help With Project?
If you are working on a project, it would be very handy to know how far along you are. Imagine if your project breaks into parts that could be shown on a chart. That way you'd know exactly how much progress you had made. That's the idea behind a Gantt chart — an easy-to-use visual schedule of your project.
In other words, Gantt charts are ideal for those who want to visualize their project and ensure nothing interrupts the schedule. You can use a Gantt chart to plan that one-off garden project or check the progress on your annual budget. With this tool, you can see at a glance which dates you have left to meet your deadline. Or when you need to start working on an upcoming project. This can help improve your organization and streamline important tasks.
Which App To Choose For Work?
There are plenty of Gantt chart apps online that let you create stunning project schedules. And Kanbanchi is one of the best apps. It helps make your team more effective, by reducing the amount of time you spend in meetings trying to figure out what everyone is working on and whether it's the best use of their time.
Kanbanchi offers Gantt chart and Kanban board tools to its clients. It can manage multiple projects at a time, each in its own workspace. When all the tasks have been planned out and the necessary information entered, Kanbanchi produces a set of charts. They allow you to easily monitor the status of your project and make adjustments as needed. Try it today and see how much easier it can be to manage projects.
14. How to Run Projects with a Google Workspace Kanban Board?
You may wonder whether a Google Workspace Kanban board can perform well to run smooth, professional projects. The bad news is that there is no Kanban board tool in Workspace.
An option is to use an online Kanban tool. This makes more sense for remote teams and those project managers who have to organize a large number of tasks across their teams. The problem is that using a tool that is not with Workspace will negate some of the benefits you get from using it in the first place.
Kanbanchi Is Deeply Integrated with Google Workspace
Thankfully, there is a solution that lets you use a Google Workspace Kanban board. It gives you everything you need and is fully integrated with Google Workspace at the same time. Kanbanchi is a professional project management app that you can use seamlessly on Workspace.
This approach lets you use a comprehensive online Kanban board to control your projects effortlessly wherever you are. It will ensure that every member of the team knows what is going on and remains engaged with the work too. The interface is very similar to what you know from Google. So adding it to your daily workload is something that is fast and easy to do. This means that everyone should be up and running with it in minutes.
Make Your Projects Easier to run with Google Workspace Kanban Board
The Kanbanchi tool could be the best solution in place to run better projects from now on. By using it together with Workspace, you will get a powerful set of online tools that make life easier for you and your team.
15. Is There a Google Workspace Project Management Tool Available?
If you have already tried the Google Workspace suite, then you know that it is a useful collection of apps that let you collaborate easily with colleagues. Yet, the lack of a dedicated Google Workspace project management tool might make you wonder whether it is truly suitable for your team’s needs.
This is a vital point, as an integrated project management tool is necessary for letting you all work together seamlessly. Without this capability, you might find that you need to create manual workarounds for your projects or use one of Google apps in a way it wasn’t designed for.
The Kanbanchi Option of Google Workspace Project Management Tool
The good news is that you can now find a Google Workspace project management option by looking at Kanbanchi. This is an app that has been specifically created to work perfectly with Workspace. This means that it gives you a familiar user experience while adding in powerful project management features.
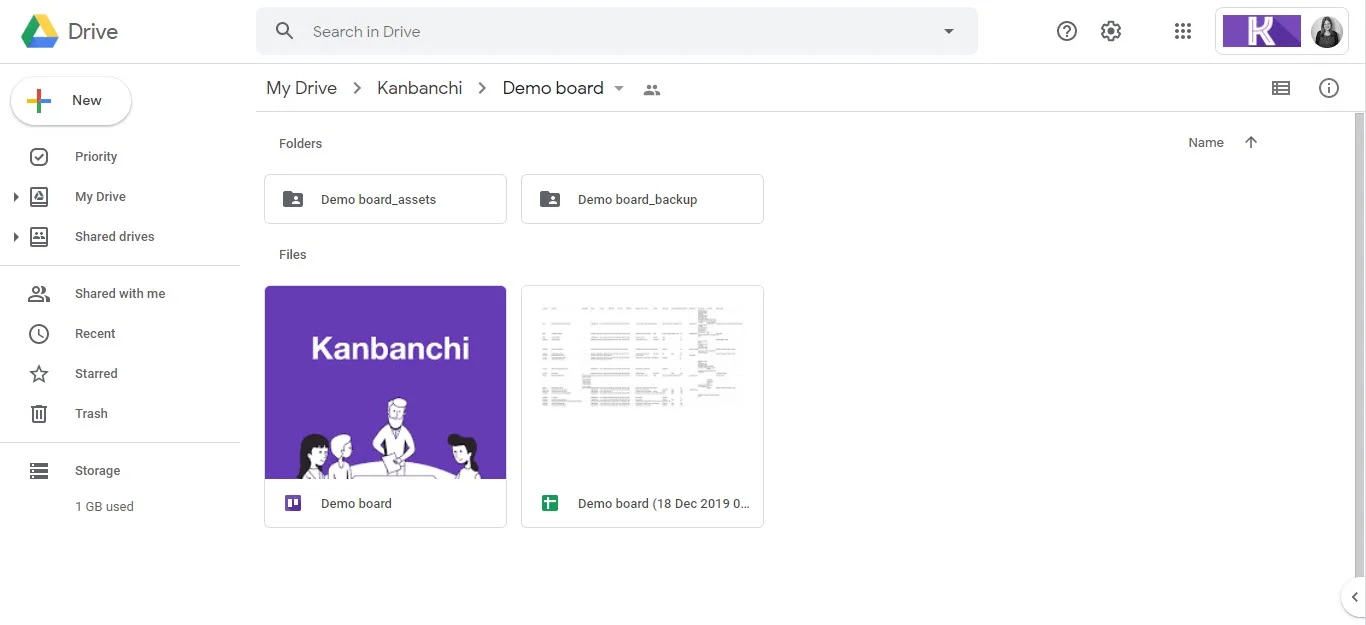
With so many people looking for a project management tool that works smoothly with Workspace, this option can prove to be the right choice. It works just like all of the other files you have in your Google Drive, allowing you to create project boards that you can share using Drive or else open from within the app.
You’ll be ready to use it in next to no time. You'll instantly access tools such as Kanban board, Gantt chart, and resource board. You can also effortlessly attach any files needed from Drive and synchronise everything using Calendar.
Don’t waste time looking for Google Workspace project management solutions that aren’t right for you. The Kanbanchi tool gives you all of the features you need, together with seamless integration. Give it a try and make Google Workspace even better.
Kanbanchi for Google Workspace is the online project management software with Kanban Board, Gantt Chart, and Time Tracker. Kanbanchi needs no installation because you can access it in your browser. It is also widely used for team collaboration and task management because it provides a platform all team members can access simultaneously. Kanbanchi complements Google apps and is integrated into Google's infrastructure.
Kanbanchi was initially explicitly built for Google apps users. You can sign up with a Google account, manipulate your project boards as files in Google Drive, give flexible access permissions, create events in your Google Calendar, attach Google docs, sheets, and forms to your boards, and more.
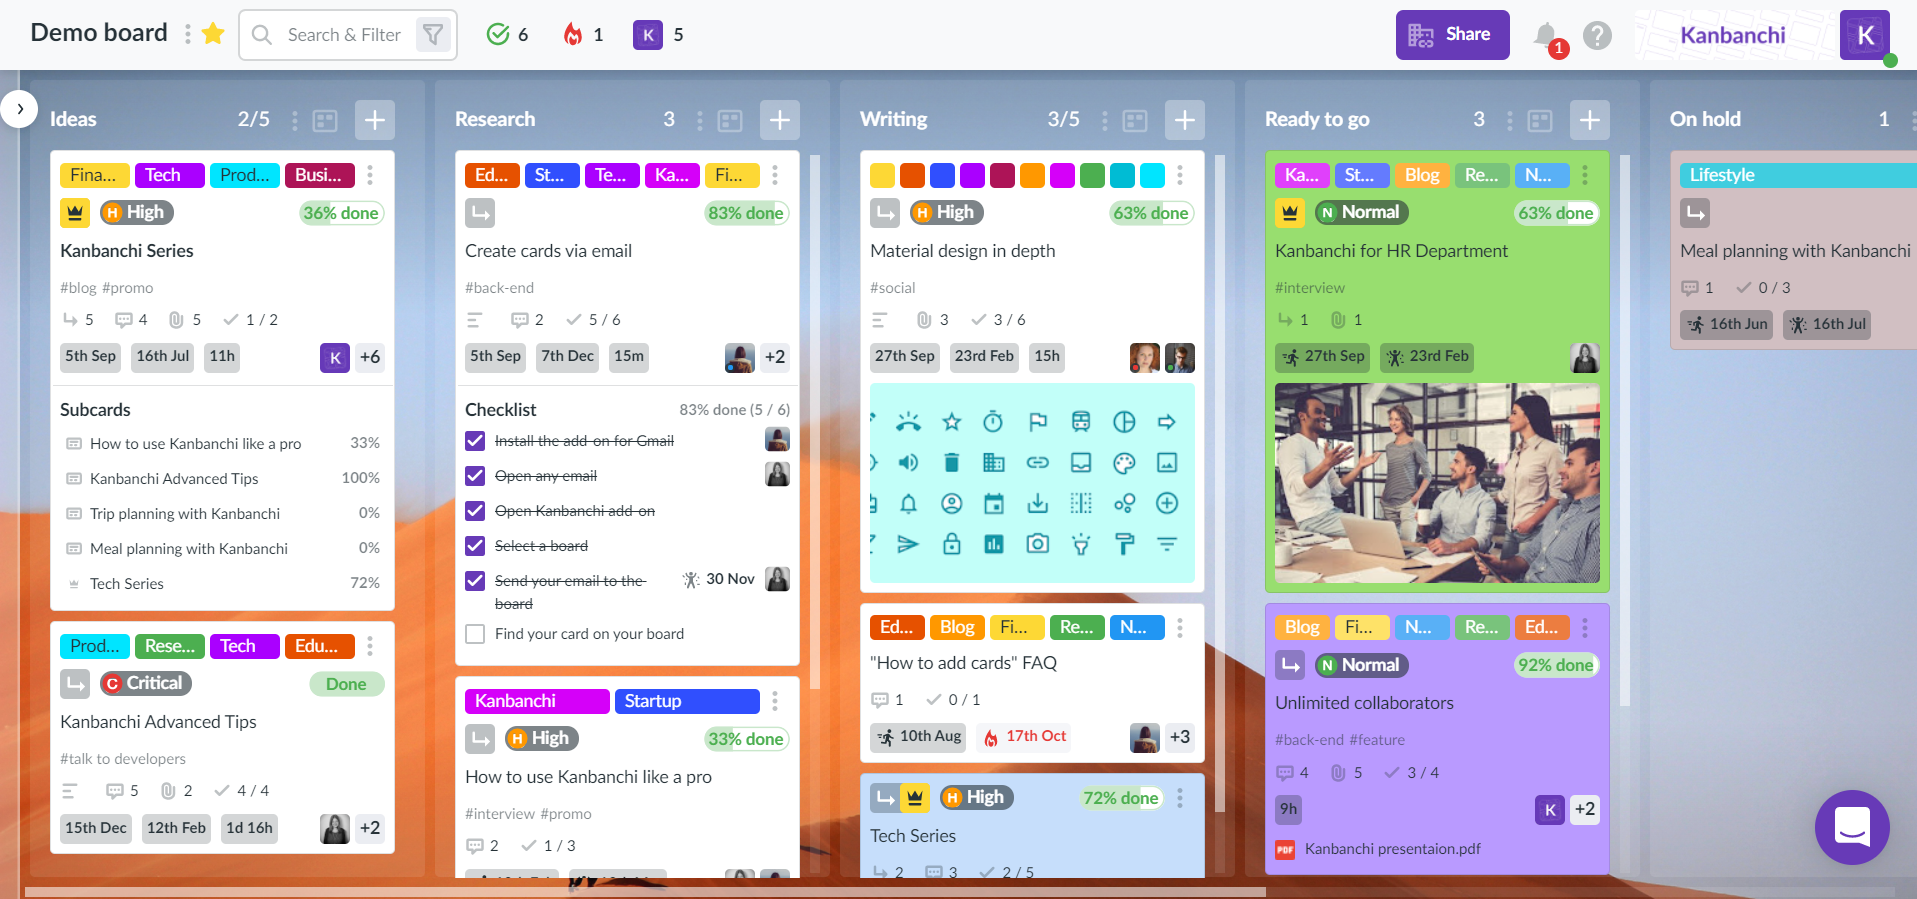
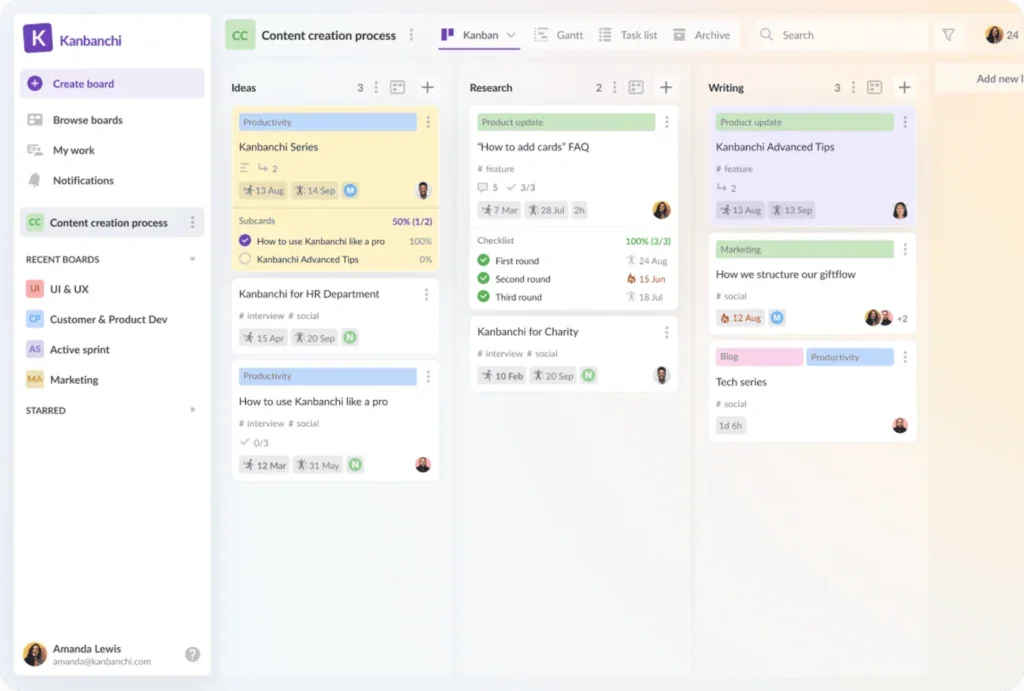
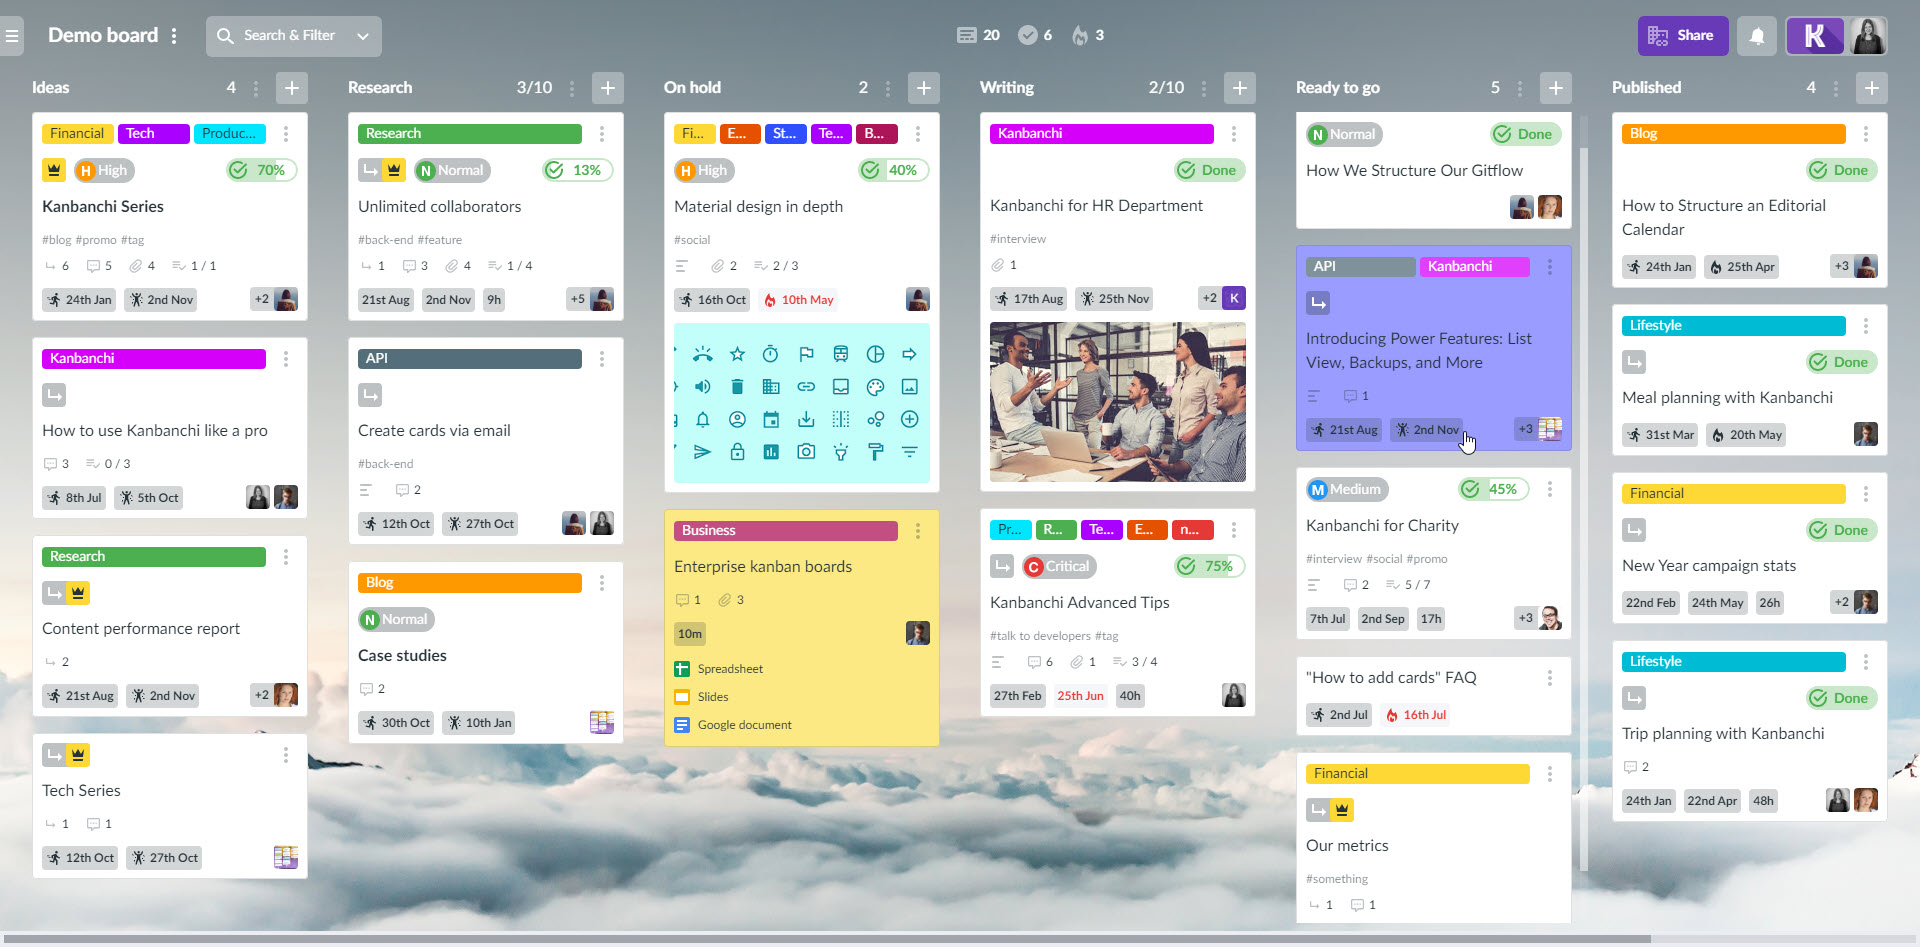
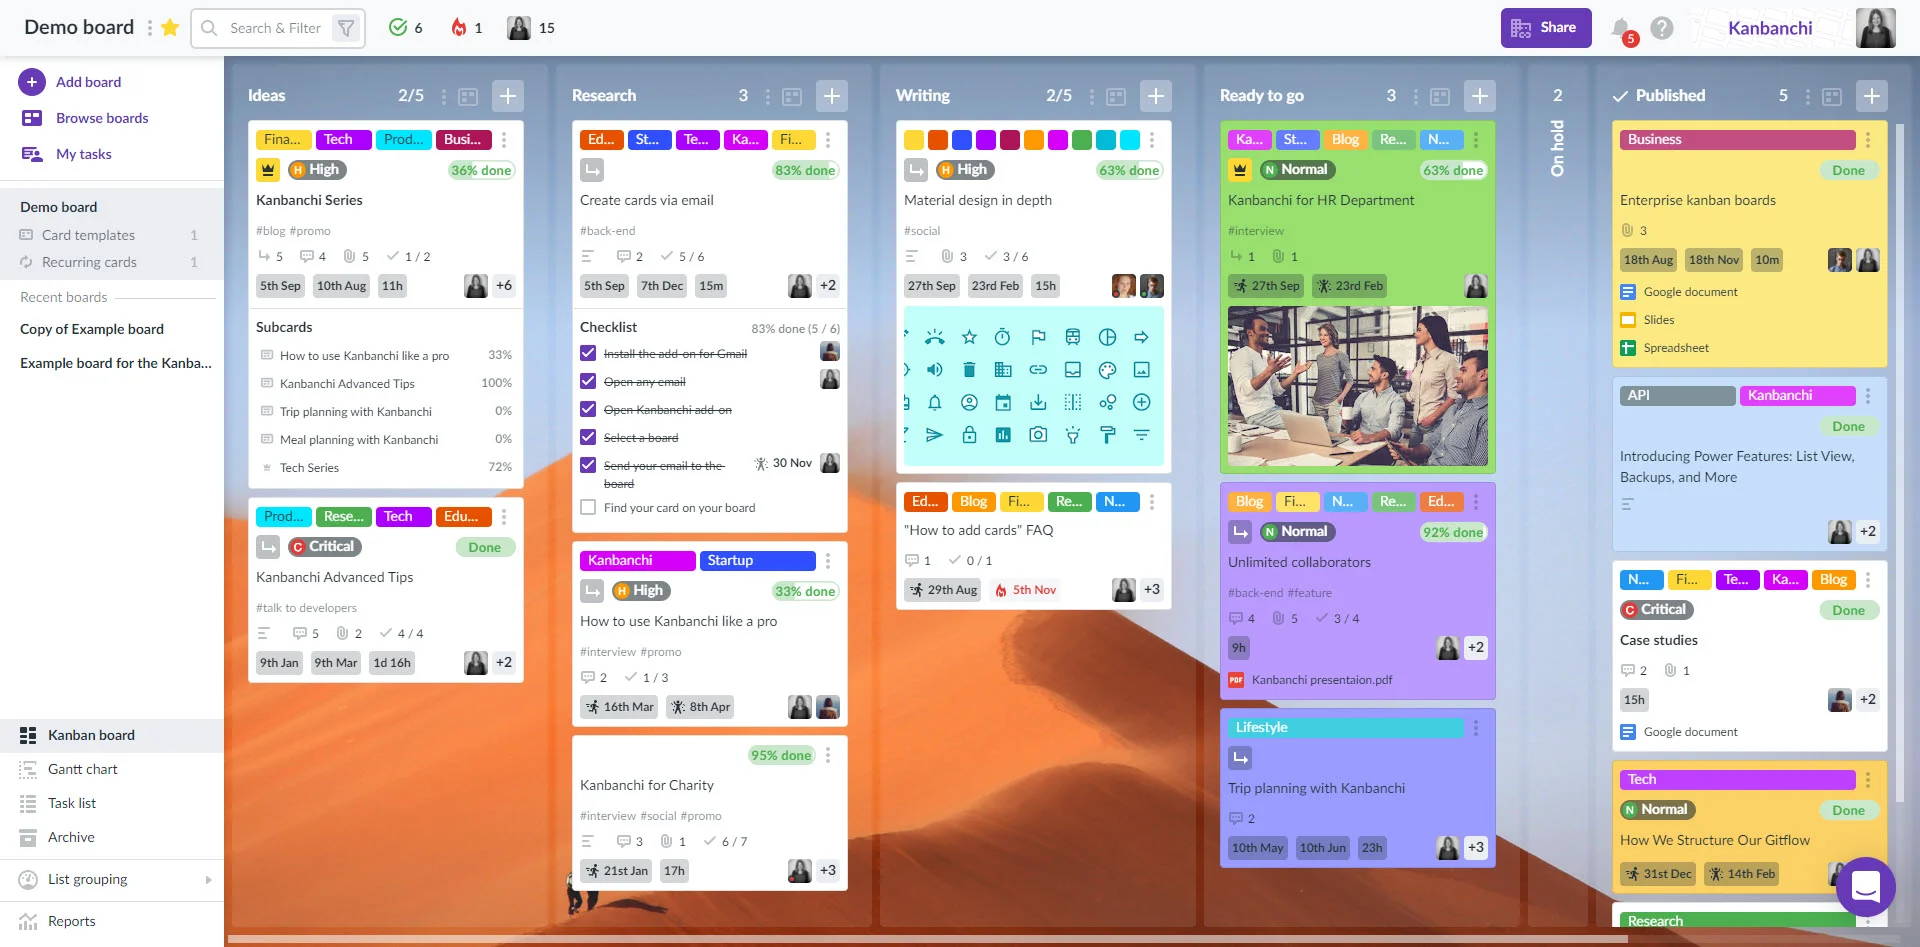
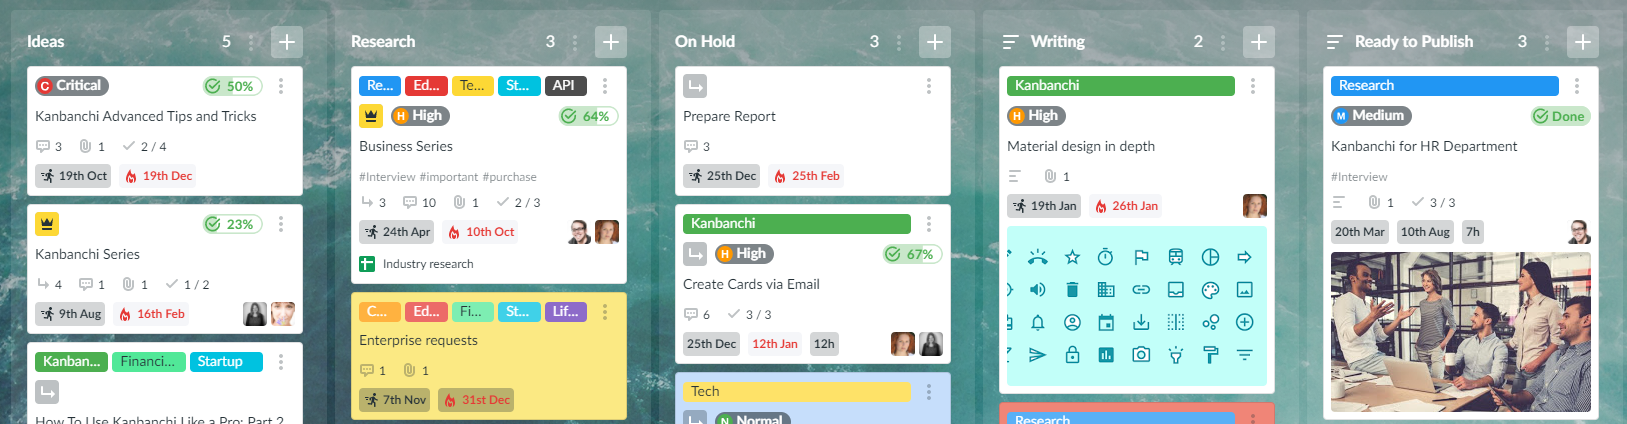
Manage tasks on the Kanban Board
Kanban boards are powerful project management tools. They're trendy among teams using agile and scrum methodologies in their workflow. Cards grouped into lists and placed on one board can give a clear picture of your project. Sharing boards with your colleagues within your corporate Google Drive provides an easy and fast way to collaborate. Set up a board for your project, share it, and collaborate on tasks in real-time.
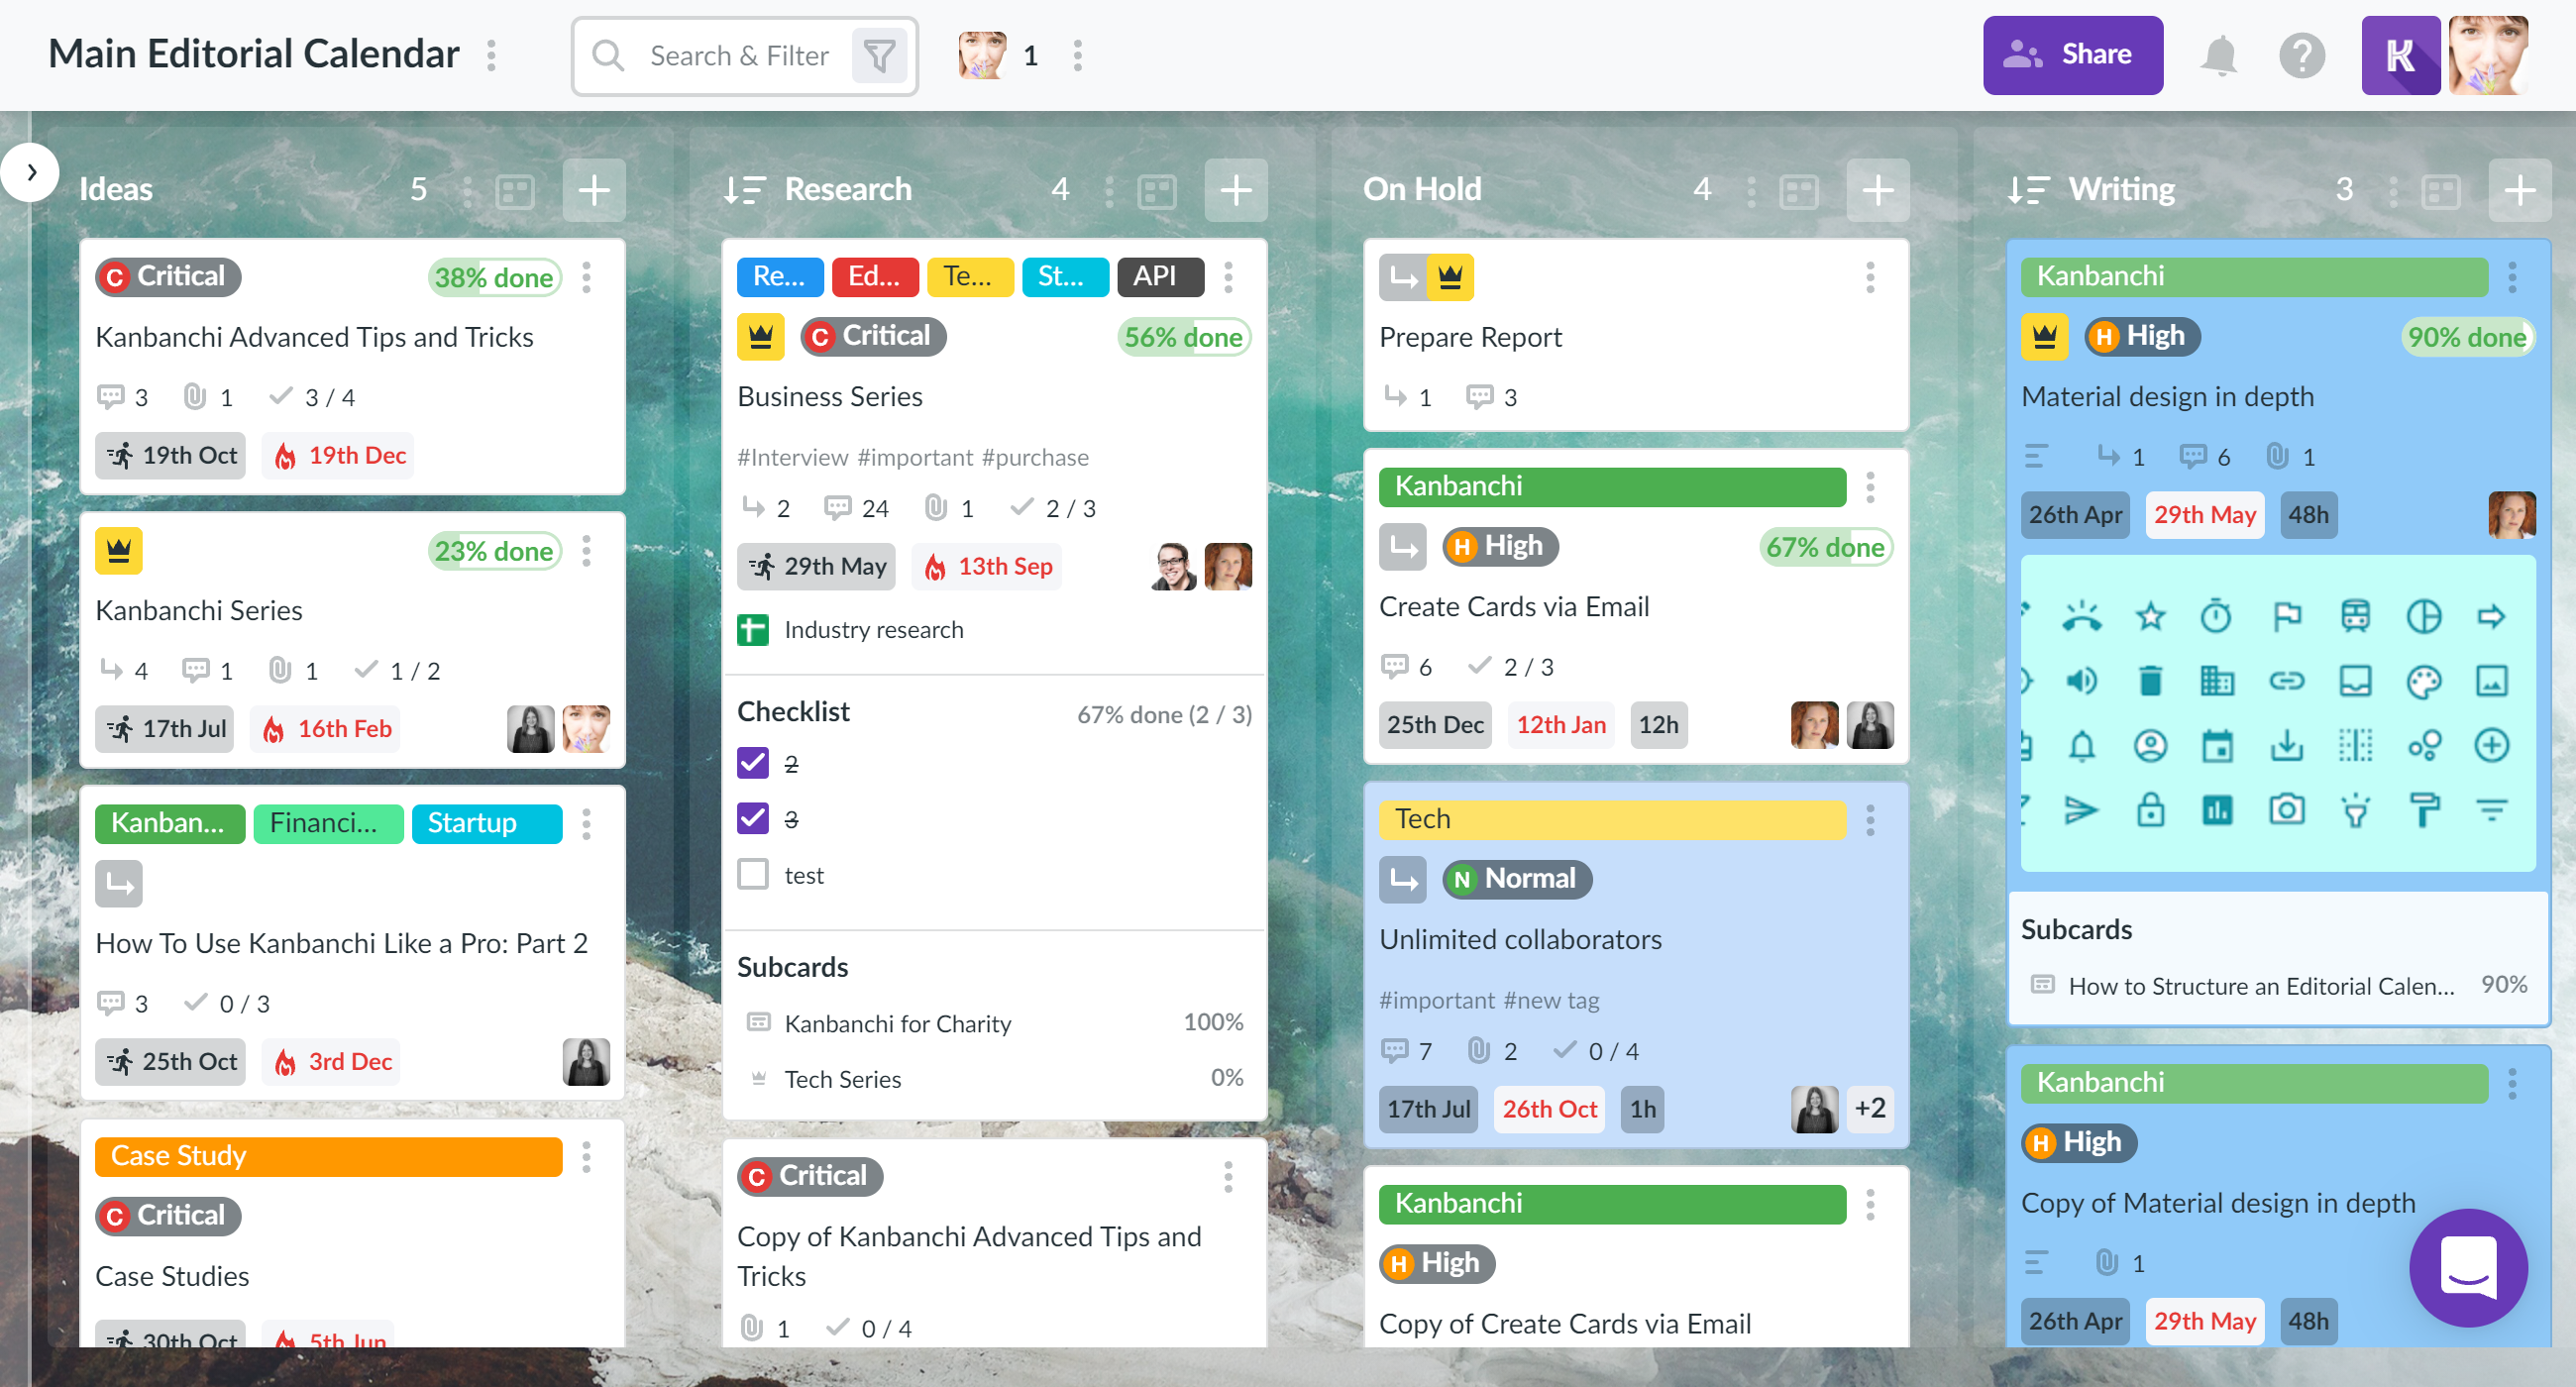
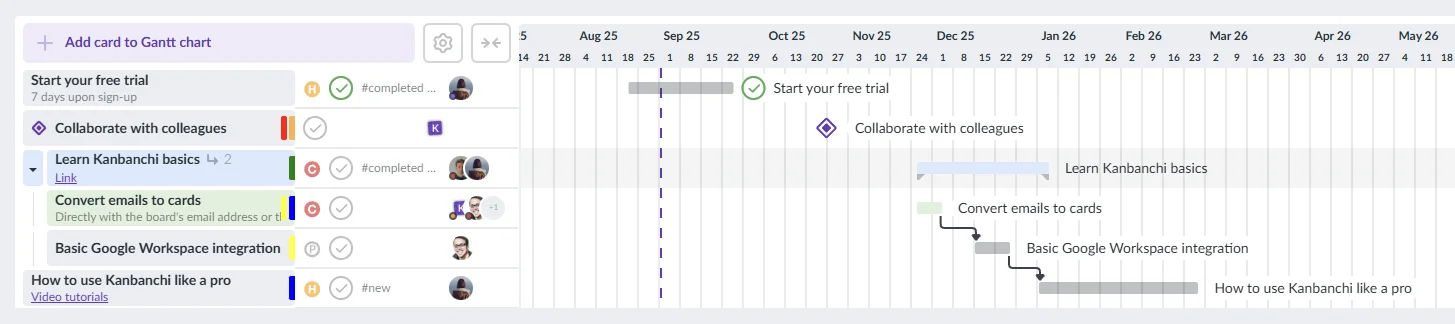
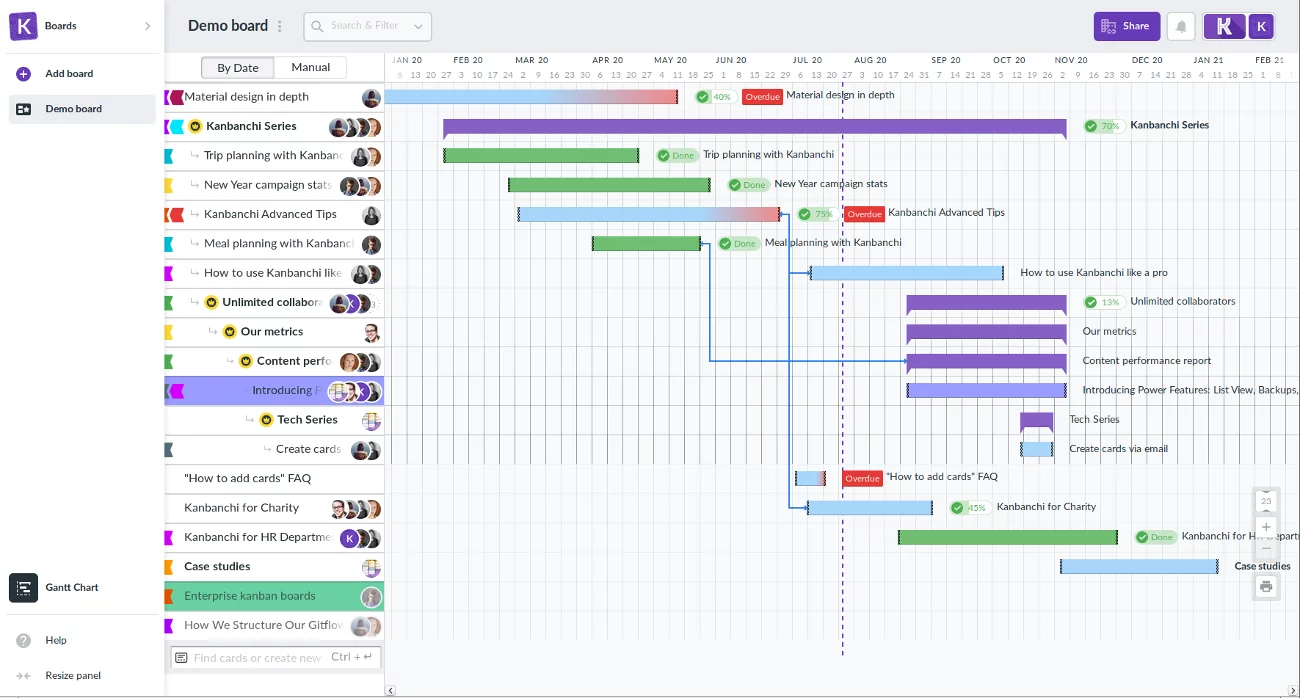
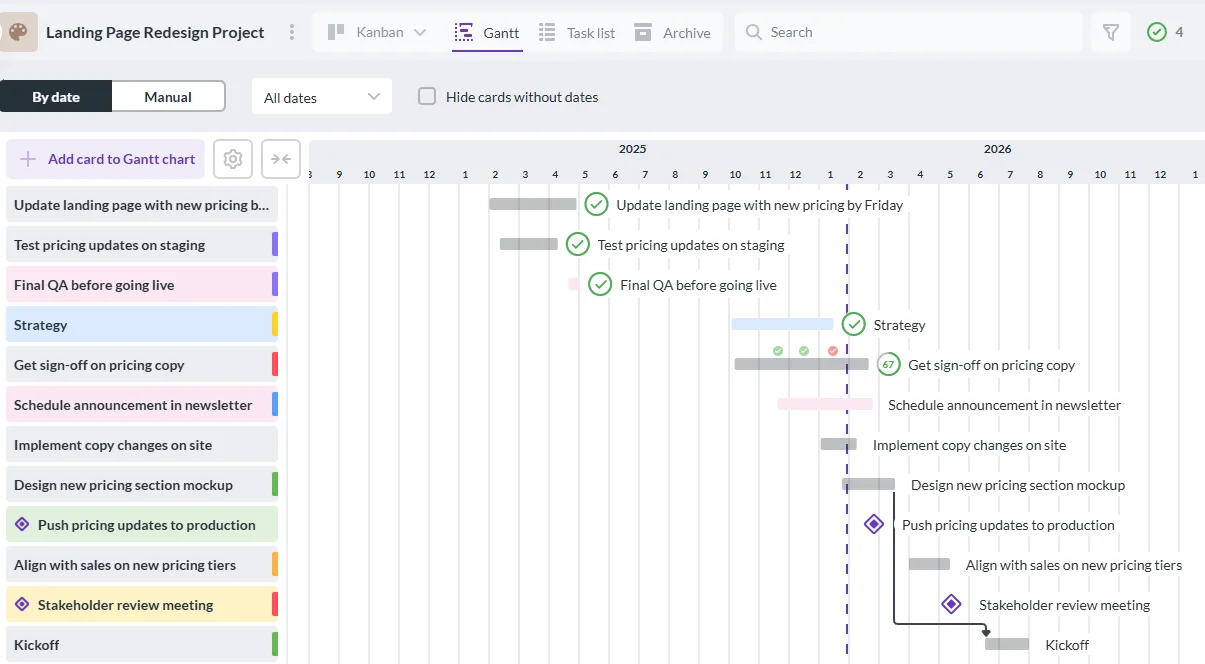
Plan projects on the Gantt Chart
All Kanban boards in Kanbanchi may be converted to a Gantt chart in one click. You will see task relations in time and understand your projects' chronology. Adjusting the sсhedules on the Gantt chart is very easy. Just drag the edge of the bar. The Kanban board will reflect all the changes you make on the Gantt chart and vice versa.
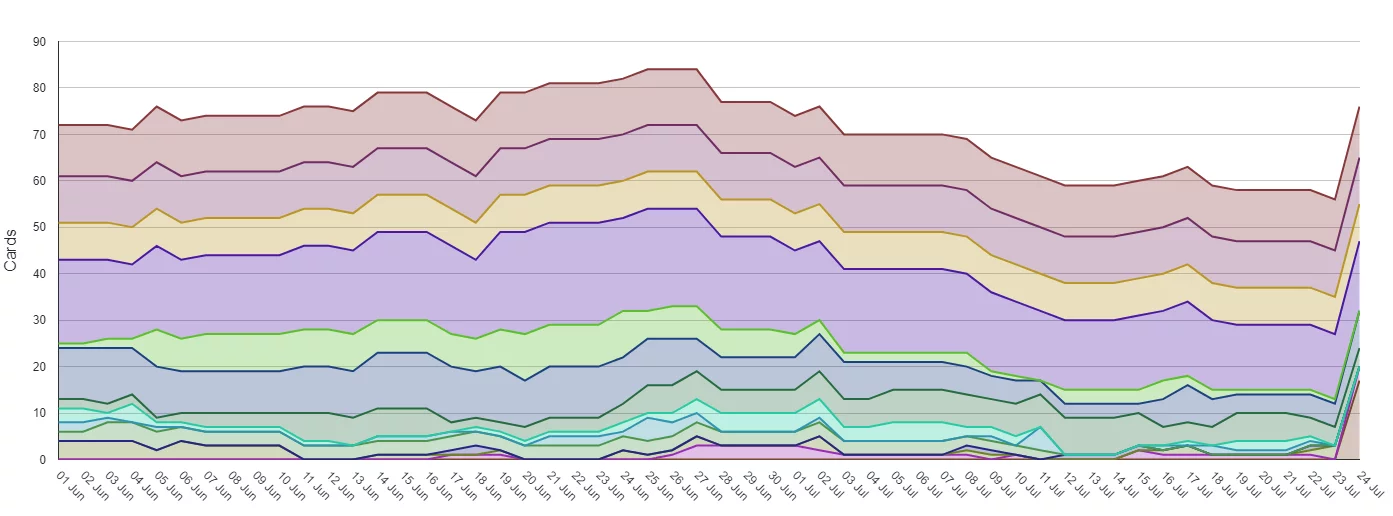
Check your team's performance with Reports
Kanbanchi has a collection of built-in reports that may be created based on your boar data. The collection includes the most popular charts, like the burn-up/burn-down chart, the cumulative flow diagram, the performance chart, and more. It helps you monitor your team's progress and change your work processes if necessary. Analytics is the key to productivity, so checking your progress regularly is crucial.
Enterprise-ready features
Companies using corporate Google Workspace tools greatly benefit from a domain installation of Kanbanchi. This provides a smooth adoption of the app in the whole organization. All users within the domain will get access to the application and, therefore, may start collaborating whenever they need to. Being built on the Google Cloud Platform, Kanbanchi offers the highest security level. It meets rigorous privacy and compliance standards that guarantee your data is safe.
If you want to learn more about Kanbanchi as an enterprise app, check this page, or start your free trial now.
The Kanban methodology is a highly popular type of workflow management system. But what does Kanban board mean, and how can you use one to improve your team’s task management and project management processes?
The Basics
A Kanban board is a tool that lets you visualize work as it moves through different stages. This board typically splits into three columns; To Do, Doing, and Done. Cards representing tasks are moved across the board to show their current stages.
The name ‘Kanban’ is based on a Japanese word, which is written as 看板 and translated literally as ‘signboard’. This methodology appeared on Toyota factory in the 1940s, to make their processes more efficient. When used alongside Lean management, it helps companies to boost productivity and lower waste.
Who Could Use the Kanban System?
What does the Kanban board mean for different industries and how can it be incorporated into companies? Toyota still uses this workflow management method and it has achieved widespread acceptance in the manufacturing sector.
It can also be used in many different sorts of companies, from technology start-ups to software development teams, and anyone else who has to track tasks as they move through the team.
How to Choose a Kanban Board
The earliest boards of this type were simple whiteboards where cards physically moved between columns. The arrival of digital Kanban tools like Kanbanchi means that even large teams and those with remote colleagues can use this method of improving their workflow.
Kanbanchi has an intuitive interface and integrates seamlessly with Google Workspace, meaning that you get the classic benefits of the Toyota factory, but also a smooth online experience where you track time, run reports, assigns tasks remotely, and a lot more.
Try Kanbanchi to see why this way of working is so popular!
Scrum is an Agile framework that helps teams generate value through adaptive solutions for complex problems. It is widely used inter alia for project management. Generally, a scrum project management app allows a team to control the processes comprehensively and follow all the scrum aspects.
Scrum Project management
In some cases, scrum beginners may find it difficult to get used to the framework. No wonder! Scrum has many specific elements, terms, aspects and roles. Therefore, it is important to highlight some key points and terms. Scrum Glossary may come in handy.
What roles are used in Scrum?
Let's get acquainted with the roles.
Product owner: the person accountable for the outcome of the product. The PO finds ways to maximize the value of the product, indicates tasks and prioritize them.
Scrum master: the expert who controls that the process follows the Scrum framework. The main role of the Scrum Master is to guide the team.
Development team: people who execute the tasks.
What are the key elements of Scrum?
Sprint and its planning
Firstly, in Scrum, all projects consist of Sprints. Sprint is a time-boxed period when a team works to achieve a goal. Sprint may be considered as a sort of 'container' for Scrum events and activities. Each Sprint ends with delivery. Typically, a Sprint lasts for 2 weeks. However, each team set different timeframes taking into account process specificity. Before a Sprint starts, the scrum team defines the goal, discusses it with the Product owner and plans the tasks in the sprint backlog.
Daily scrum
The team has a daily meeting which is known as daily scrum. Usually, it happens at the same time every day. Also, the duration should be limited to no more than 15 minutes. Such meetings help the team to stay on the same page and keep abreast of developments.
Sprint review
When the Sprint is over, the team makes its review. They discuss what they managed to do within the Sprint as well as what aspects of work stayed undone. Usually, stakeholders join meetings as well. They discuss with the team the increment of the product resulting from the Sprint. After that, future projects can become the topic of discussion.
Sprint retrospective
Likewise to Sprint review, Sprint retrospective is a necessary part of the whole framework as it serves for the analysis. During the retrospective, the team considers the past Sprint under the guidance of Scrum the master. They decide what went fine during the Sprint. Certainly, the team discusses the obstacles they had during the Sprint. Subsequently, they decide how to increase productivity and avoid mistakes during the next Sprint.
Scrum Board
With the help of these key elements, the Scrum method ensures coordinated teamwork. A team may achieve even more using a Scrum board. It can be a physical board, however, it will be much more beneficial to have a board in a Scrum project management app. It will make the whole information visible. With its help, it is easy to monitor and manage the Sprint backlog.
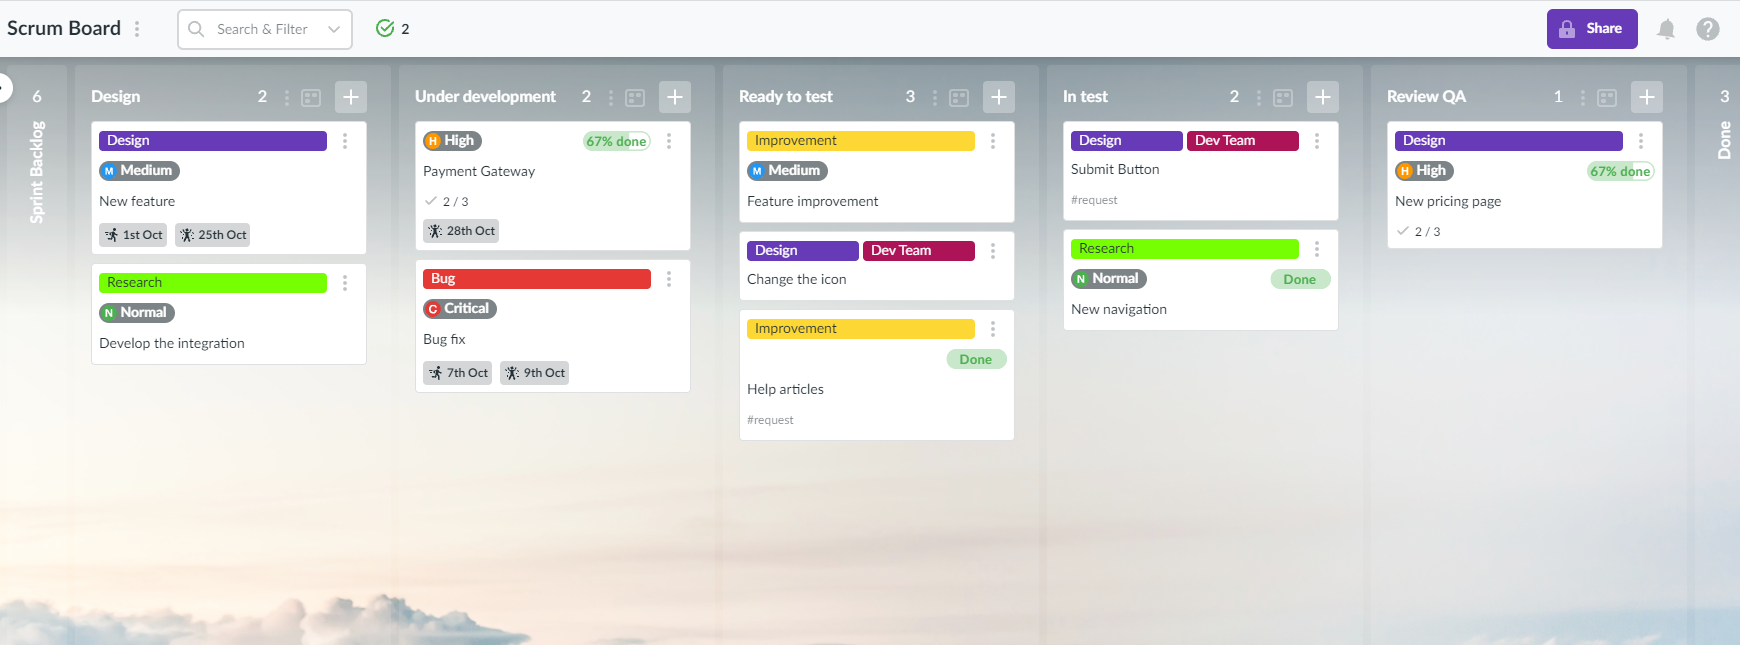
Kanbanchi is an app that can be used for these purposes. Kanbanchi board is a convenient tool to keep track of tasks. All the stages of the Sprint can be easily represented as lists, e.g. Backlog, Design, Under development, Ready to test, In test, Review/QA, Done. Cards will represent tasks.
One board may hold the information about one Sprint. Alternatively, you may place several Sprints on one uniform board. It can be easily implemented in Kanbanchi as it has various features for task categorization, e.g. colour labels, tags, card colours. Once, a Sprint is over, all the tasks associated with it can go into the archive where they will ve securely stored.
Assign tasks to team members. What's more, Kanbanchi allows set roles for team members. Thus, even a newcomer will understand who is doing what in the team. For instance, you may set such roles as Product Owner, Scrum Master, Designer, Front-end developer, Back-end developer, Tester, etc.
Of course, Kanbanchi will become a great choice not only for development teams. Even if the other department of the company is not going to do Scrum, they still can easily use Kanbanchi for their purposes as the tool has a flexible interface that can be quickly adjusted to any workflow. Don't hesitate to try Kanbanchi within your company.
In a startup or a multinational company, the critical values of teamwork remain the same. Cohesive communication, mutual trust, and clear accountability are crucial for team collaboration. Technology has empowered teams with various team collaboration software to address specific teamwork challenges. So, what is team collaboration software? It should meet the following criteria:
it’s easy on the pocket;
not specific to any industry or niche;
user-friendly and intuitive;
provides the ability to allocate tasks and monitor the workload of team members;
has effortless integrations with email, scheduling and file storage services.
What kanban tool does Google Workspace have?
One of the main packs for team collaboration is Google Workplace. It is a collection of tools developed by Google Cloud. Some of its popular apps are Gmail, Meet, Calendar, Docs, Sheets, Slides, and Sites. Almost every team collaborates on different documents, sheets, slides, etc.; some need kanban to streamline processes on boards. But it turns out that Google Workspace lacks task and project management tools.
And here comes the tool smoothly integrated with Google Workspace. Kanbanchi is a team collaboration software for task and project management. Firstly, Kanbanchi is easy to use, and even non-tech heads quickly get on board. Secondly, the tool contains essential collaborative features. For instance, all the changes are reflected in real time, and you won’t miss any changes on the boards with the help of notifications. You know who is collaborating on the board and on which specific task. The team workload monitoring tool of Kanbanchi helps to distribute tasks smartly. At the same time, reports help the team evaluate the results. Above all, it is integrated with Gmail, Google Calendar and Google Drive, which makes Kanbanchi a perfect solution for teams on Google Workspace.
20. Is there a secure team collaboration software?
Working in a company means working with other people. No matter, whether you are an employee, freelancer, contractor, or entrepreneur - you always have to cooperate with others. And fortunately, thanks to modern technologies, doing so has never been easier. Communicating faster, more successfully, and with less effort. Collaboration apps are changing the way we work.
But despite the growing popularity of collaboration tools, the level of protection offered by most collaboration products is simply not good enough. When you discuss how to protect your company’s sensitive data, the last thing you want to do is create opportunities for hackers to have access.
Why Is it Important To Use A Secure Team Collaboration Software?
The danger in this use of collaboration apps is that they store files online in the cloud which means they are not only available to anyone with access but are also vulnerable to attack. Companies need to think about security even more than they did before, in order to protect themselves. A study with 500 enterprise participants showed that 2 out of 3 companies have been attacked via collaboration software in the span of one year. Also 3 out of 4 participants believe that the number of such attacks will be increasing.
In today’s IT climate, the single biggest point of vulnerability for organizations is their people. Especially during the times when remote work became a new normal. This raises a big question: how can we make our people more secure? Even if you aren’t too concerned about sharing your business with the outside world, anyone within your company should be able to see what you are posting, so this is an important feature to look for. Because this information is out in the open, privacy features are important to consider when choosing team collaboration software. Employees will be working on projects that are sensitive, so limiting access to these projects will ensure that you don’t have any inadvertent leaks of sensitive information.
How To Protect Your Data?
To protect your company from hacks, you will need to choose the right security software. This requires looking at different security features. Many hackers try to exploit well-known weaknesses in older applications and common passwords. You can reduce your risk of attacks by protecting yourself against these problems. Most major security packages offer multiple features that work together to detect and prevent hacking issues. Open communication is also key for protection from hackers. It can allow you to find out about potential threats quickly before they become a problem.
Kanbanchi Is A Secure Team Collaboration Software
As Kanbanchi is being built on the Google Cloud Platform it is entirely covered by its privacy and security policy. Also, Kanbanchi doesn't store data on the apps side. All the data is in our Google Cloud database is encrypted at rest. Kanbanchi employees or third-party can not access it. Also, attachments are stored on the client's side, in your Google Drive. So you can say it's a safe software for your team.
21. Google Keep Alternative: Convert Notes to Actionable Tasks with Kanbanchi
Many Google users prefer Google Keep to other note-creating apps. First of all, the app is part of the Google ecosystem meaning that it has the same intuitive and light interface as other Google apps. The second reason is that notes are visual and easy to scan with a glance, they look familiar as sticky notes on your wall. However, the order of notes may be rather chaotic and it's hard to keep track of them when you start having more than 10-15 of them. There is a Google Keep alternative with broader functionality but a similar neat design and intuitive interface. It is called Kanbanchi and it's designed specifically to add value to your Google Workspace products.
Kanbanchi instead of Google Keep or together with Google Keep?
Google Keep is a good app to make notes, for example during a meeting. Later you will want to turn them into actionable tasks and actually start working. Google Keep is not meant for that. Kanbanchi will be a good choice to keep track of your tasks made out of notes and also to work together with colleagues. Kanbanchi also has a number of features for task management that makes it a more powerful tool than Google Keep.
Kanban boards to support your workflow
Easy sharing within Google drive
Real-time changes for faster collaboration
Gantt chart to develop a strategy
Google Workspace integration to involve all company
Gmail integration to convert emails to actionable tasks
Google Calendar sync to help you with scheduling
This is just a shortlist of main functionality, though there's much more in the app that will make your teamwork more effective.
Summarizing it all, you may use Kanbanchi as an alternative for Google Keep or as a complementary app that will help you to convert your notes to actions.
Is Kanbanchi good for personal use?
Yes, 13% of Kanbanchi users are individuals who care about being productive at home. Kanbanchi may be used for personal event planning, structuring your schedule, or collaborating with friends on your shared hobby.
22. What is web-based team collaboration software?
Are you trying to solve communication and productivity issues in your workplace? If your answer is yes, then you might be searching for web-based collaboration software. Maybe you’ve even already heard about it before. And now you are wondering if it could help your team. Today it’s important to make the most of your company’s human capital together with available digital tools. This can increase your team’s productivity and improve customer experience. In this article, I will show how web-based collaboration software can make it possible by building a connected workplace.
What is web-based collaboration software?
Web-based collaboration software is computer software that you access via a browser. The internet today has become an integrated part of business communication. Before computers and the Internet, people worked together face-to-face in offices and conferences. However, with technological breakthroughs in telecommunications and information sharing, collaboration has gone digital.
Team collaboration tool simplifies complex operations. It does it by reducing time spent on routine, repetitive processes. From day one, collaboration software delivers measurable results. It increases communication, productivity, and improved decision-making.
What can web-based collaboration software accomplish?
With collaboration software, your organization can transform into a high-performing team that will increase productivity and creativity while also offering better customer service across all departments. Here are some of the accomplishments your team can get:
Increased productivity
Organized communications help teams eliminate time-wasting, repetitive discussions. Collaboration software keeps information in one place. It also connects people to streamline everything you need.
Transparency
Transparency is another element of good collaboration software. It gives real-time visibility into the work that goes on. Moreover, you can see the progress of projects, and measure your own impact and efforts. Transparency makes employees feel as if they’re part of the process. It gives them the ability to reach their full potential as a team.
Positive work culture
A direct connection with team leaders and colleagues helps foster trust and mutual respect. This leads to work getting done quickly, easily, and productively. A positive office culture keeps employees engaged and active.
Kanbanchi is a web-based team collaboration software. It allows you to communicate with your team and organize the work process. You can access Kanbanchi from any device with an Internet connection. Also, you easily share data between the team members in Kanbanchi. The best part is that you can easily integrate it into Google Workplace. Awesome features like Kanban Board, Gantt Chart, and Time Tracker make this software stand out from the others.
Give it a try and you will see how connected and productive your team can be.
23. Asana Alternatives: Kanbanchi for Teams on Google Workspace
Checking Asana alternatives on the Internet gives you many options. Kanbanchi has everything your team needs to be synchronized and reach your goals faster. Collaboration platform, specific project management toolset, resource management, and much more. At a very reasonable price
You may start working with Kanbanchi right when you sign up. Ease of use is what we take pride in. Teams start getting value right at the start. Intuitive and familiar Google apps interface will help to save time on learning. Kanbanchi is developed specifically for Google Workspace users, that's why people typically spend 15-25 minutes in the app and start actually working with it.
Kanbanchi delivers value right at the start
If you like the idea of getting value out of the app without spending much time learning it, then, Kanbanchi is exactly what you need! Here are three extremely simple steps to start working with Kanbanchi.
Watch a short video introduction to Kanban boards (1 minute)
Create a project board for your team, add cards (the tasks you are currently working on), and share it with your teammates (5-10 minutes). Watch our video tutorials for more detailed guidance.
Kanbanchi lives and works inside your Google Drive. It also stores information there. All you need to sign up and then log in is your Google account, no other logins, and passwords. If you feel the need for a project management app inside your Google Workspace, then Kanbanchi is your best choice.
Store your important files and documents in your company's Google Drive, and have them attached to project boards in Kanbanchi at the same time. This is an extremely secure way of providing quick access to the information related to your team projects without uploading it to another application.
Other benefits of seamless Google Workspace integration include:
Attaching files from your Drive/Shared Drives to Kanbanchi boards in just a second;
Adding tasks to your Google calendar and any Google calendar that you have access to;
Having similar familiar and intuitive interface;
Converting emails to tasks from within your Gmail (including mobile Gmail);
Creating tasks from Google Forms;
Inheriting access permissions from your Drive settings the same way it works for all other files in your Google Drive;
Exporting boards data to Google Spreadsheets. Later you may use them for various purposes;
Creating custom reports out of exported Spreadsheets using Google Data Studio.
Learn more about Kanbanchi as a project management tool inside Google Workspace
How to make sure Kanbanchi is the project management software my team needs?
Let's be honest, there's no one ideal software that fits them all. You need to evaluate how this app or another can help you achieve your team goals. So you need to define your goals first. What you would like to do with project management software? Then try to set up a board according to the goals of your project.
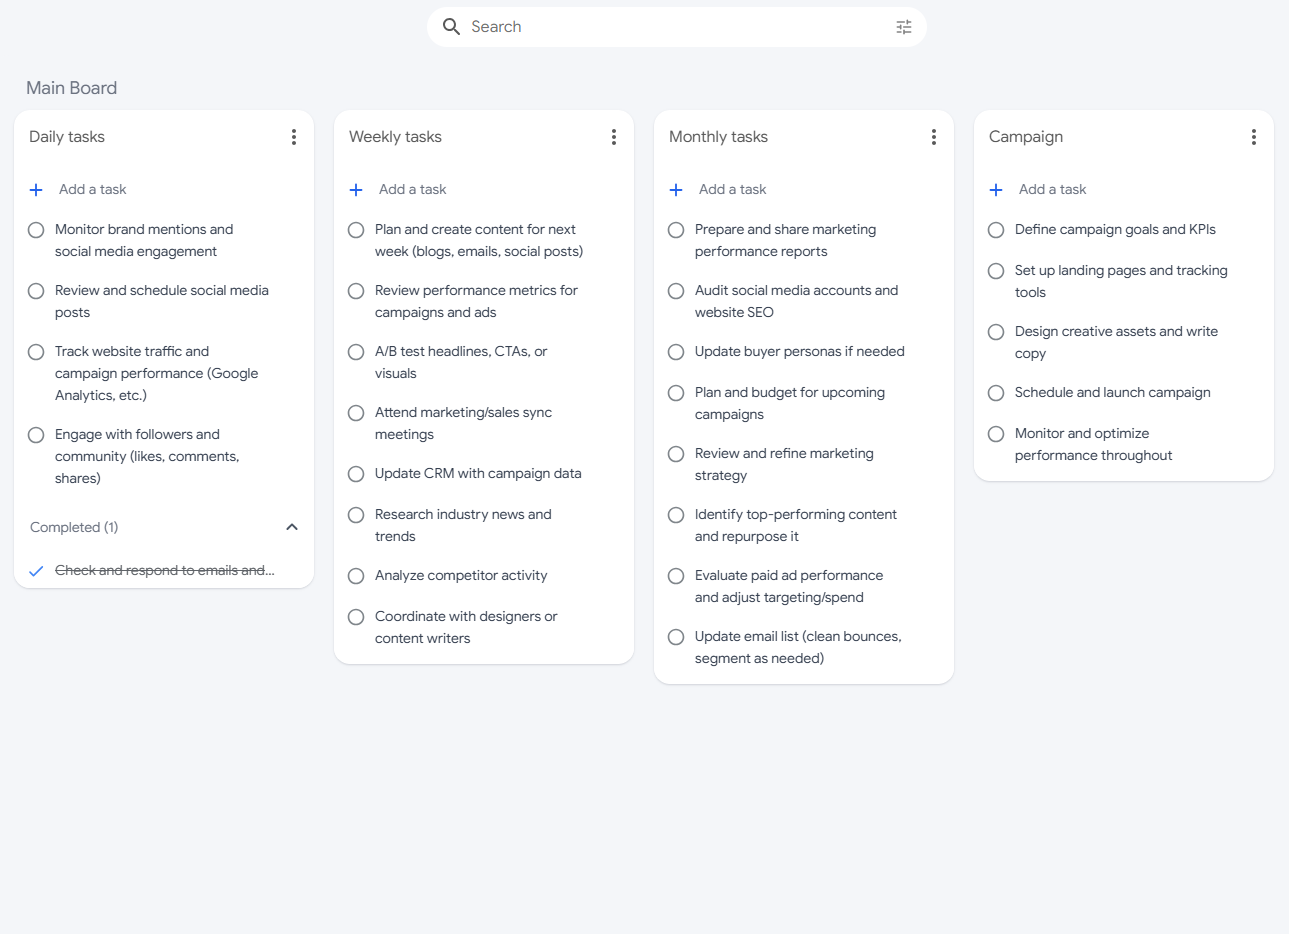
Think about the tasks that you need to perform to achieve your main goal. Split complex goals into smaller goals that are easier to reach. Then you will know what exact tasks you need to do. Think about the stages that those tasks will go through. In a very simplified model of a kanban board, these stages are 'To do' - tasks that you need to do to reach your goal, 'Doing' - tasks that you are currently performing, and 'Done' - what you've already accomplished. Your board will look like this.
Start with a free Kanbanchi trial, our team will be with you along the way, we will help you with your boards during the onboarding process. Just get on board. Kanbanchi board
24. Monday Alternatives: Kanbanchi for Google Users
Looking for Monday alternatives? What is the key difference that is very important? Kanbanchi will be the best fit for teams that use Google Workspace. A familiar interface and intuitive design save you time on learning the app. All you need to log in is a Google account, and you are not limited to the file storage size.
With Kanbanchi you won't need to think about how many boards you've created and how many documents are attached to your projects. You may keep them all and get back to them whenever is necessary. In general, professional Google user spends 15 minutes in the app before they can create a project board and start working with a team.
What makes Kanbanchi stand out among Monday alternatives?
We are sure you've heard about millions of investments raised by Monday.com and you might be pretty amazed. On the contrary, Kanbanchi is a self-funded startup. However, we are on the market with Kanbanchi since 2014 and experience continuous growth without large investments.
Kanbanchi is a well-established business that supports the teamwork of thousands of teams around the world. The app has built-in tools that suit small teams as well as large corporations with thousands of employees. You may be sure that we won't disappear because we are backed up by the 20-year history of developing SaaS software before creating Kanbanchi.
We made Kanbanchi for Google users from the first day
Since the launch of Google Apps for work (then G Suite, and currently Google Workspace) there's no dedicated app for project management within the ecosystem. Kanbanchi from the very beginning was designed to fill in this gap.
Kanbanchi is the only of Monday alternatives that live and works inside your Google Drive. All the information will be stored there, so you aren't limited to the file storage size, and have a very secure and reliable way of linking documents to your project boards. Keep all important files and documents in your organization's Google Drive, and have them attached to project boards in Kanbanchi at the same time without uploading them to another application.
Other benefits of seamless Google Workspace integration include:
Attaching files from your Drive/Shared Drives to Kanbanchi boards in just a second;
Adding tasks to your Google calendar and any Google calendar that you have access to;
Having similar familiar and intuitive interface;
Converting emails to tasks from within your Gmail (including mobile Gmail);
Creating tasks from Google Forms;
Inheriting access permissions from your Drive settings the same way it works for all other files in your Google Drive;
Exporting boards data to Google Spreadsheets. Later you may use them for various purposes;
Creating custom reports out of exported Spreadsheets using Google Data Studio.
Get more done, get more fun! 6 steps to set up your project board
Spend fifteen minutes to set up your project board.
Sign up with your Google account.
Your first board will look like this
Think about the stages that your project has and rename your lists. Tip: the first list will have all the tasks that you need to do to accomplish your project successfully.
Fill the lists with cards. Cards represent tasks that you need to do.
Share your board with your team. Sharing works the same way you share files in your Google Drive.
That's it You may start collaborating on your board online. We'll be with you along the way to offer help and guidance.
You probably know Trello - a popular project management tool. People use it at work and home to manage tasks, chores, and projects. Although Trello is a well-known tool, users are still looking for alternatives. There are different reasons why they want to switch. Some think Trello is an excellent tool for managing projects, but it's not very good for managing ongoing tasks or Kanban boards since attachments can't be added to cards. Another reason is the lack of integration with Google.
Does Google Have Anything Like Trello?
Kanbanchi offers Google users almost everything that Trello does. It is a great project management app deeply integrated with the Google ecosystem and its apps. Kanbanchi stands out because it is built specifically for Google Workspace users. For those who need to organize tasks and collaborate with others, Kanbanchi offers a visual way of keeping your team on the same page. You will need no prior knowledge or training to use our simple, intuitive, easy-to-learn interface. The clean layout lets you focus on what’s important and stay organized.
Kanbanchi Is The Best Trello Alternative
Kanbanchi is an easy-to-use project management tool for everyone, from small teams to big corporations. It’s an excellent solution for both personal and team project management and for project management in companies that usually have to deal with various tools and apps from the Google ecosystem. Kanbanchi helps to collaborate with clients effectively, organize internal workflow, manage overall business processes, and achieve company goals. It offers many great features, like a Gantt chart and Kanban board in one app. Kanbanchi allows agile and traditional project planning, task management, time and user tracking, and more.
Seamless Integration With Google Workspace
Kanbanchi is a great tool for increasing productivity. It's a lot like Trello, but Kanbanchi is a more in-depth Google program. Here are the benefits of perfect Google Workspace integration:
You can easily add files from your Drive/Shared Drives to Kanbanchi boards and cards.
Add tasks to your Google Calendar.
Convert emails to cards/tasks from within your Gmail.
And create tasks from Google Forms.
Inheriting access permissions from your Drive settings works the same way for all other files in your Google Drive.
You can export board data to Google Spreadsheets.
You can create custom reports from exported spreadsheets using Google Looker.
No business can survive, let alone evolve and grow, without excellence in task management. Kanbanchi is a customer-first project management tool that helps teams organize and prioritize their tasks effectively. We built Kanbanchi with the goal of creating the best customer-centric project management tool that would make all customers happy. Ready to try Kanbanchi? You can start with it right away!
26. How do I export data to Google Sheets cleanely?
To export project data to Google Sheets cleanly, first prepare your project board, export it as a structured snapshot, and create separate tabs for reporting while keeping the raw data untouched. The goal is a spreadsheet that stakeholders can read and trust without needing to open the original project board.
Step 1: Clean the board before you export
A spreadsheet inherits every inconsistency from its source. Before exporting, make sure:
Every active task has an owner and a realistic due date
Color labels are consistent across all lists
Vague task names like "Fix it" or "Follow up" are renamed to something specific
Completed tasks are marked done
Comments with sensitive details are reviewed before sharing externally
Step 2: Define the purpose of the export
Before clicking export, write one sentence describing what this file is for. A weekly leadership update needs different columns than a billing review or a project archive. Knowing the purpose helps you decide what to include, what to hide, and who should have access.
Step 3: Export and protect the raw data
Once you export the board to Google Sheets, rename the file immediately using a clear pattern: i.e, Project Name – Board Export – YYYY-MM-DD
Keep the first tab as the untouched raw export. Never manually edit, delete columns from, or re-sort it. This is your source snapshot. All cleanup and reporting are better handled in separate tabs.
Step 4: Build reporting tabs for your audience
Create additional tabs for different views:
Clean view. Standardized columns with consistent formats for date, owner, and status
Summary. Pivot tables, filters, or charts for leadership or client updates
Notes. Export date, source board, and any assumptions the reader needs to know
This structure makes recurring exports faster and easier to compare over time.
Step 5: Control access before sharing
Exported spreadsheets often contain internal comments, assignee names, and operational details. Use the least-access principle: view access for readers, comment access for collaborators, edit access only for those maintaining the file. Create a cleaned version for external audiences rather than sharing the full internal export.
Quick checklist before every export
Board owners, dates, and statuses are up to date
Task names make sense outside the board
The export file is named with the project name and date
Raw tab is preserved without edits
Reporting tabs are built separately
Permissions match the audience
Kanbanchi export FAQs
For step-by-step guidance on exporting from Kanbanchi specifically, see:
Kanbanchi allows teams to export board data, including task assignments, dates, checklists, comments, and time tracking, directly to Google Sheets. Keep your project board as the working system and use Sheets as the reporting layer on top of it.
27. The Best Enterprise Project Management Software of 2025 - 2026: A Kanbanchi Comparison Guide
In the modern corporate environment, project management isn’t just about successfully tracking a few tasks. These days, an approach known as Enterprise Project Management is needed. It’s one of the fastest-growing business markets, estimated to reach $25.67 billion by 2033. What is it? Well, EPM is the engine that drives initiatives and transforms executive vision into deliverable results. So, choosing the right platform is essential. When teams manage a complex portfolio across multiple departments, a basic task manager will inevitably fail. Large enterprises need solutions to scale securely and deliver the results they need, all on demand. The best enterprise project management software will bridge the gap between high-level strategy and daily operational tasks.
It’ll offer comprehensive features like:
dynamic resource allocation
real-time risk assessment
airtight security protocols
Without these, organizations risk a range of problems that can harm their reputation and future growth. That’s where Kanbanchi comes in!
We’ve put together this guide for team leaders, IT decision-makers, and executives navigating these choices. In it, we’ll objectively review some of the top EPM vendors, including established names like Wrike, monday.com, and Smartsheet. We’ll also introduce you to Kanbanchi, a real ladder in professional enterprise management software. Step forward and discover some great solutions today.
Kanbanchi interface showcasing a Kanban board used within the Google Workspace infrastructure. Lists represent the workflow stages, and cards represent the tasks.
The Unique Project Management Challenges Faced by Large Enterprises
Ever wondered why standard project management tools struggle when deployed across big companies? The difference is that what works for an SME often descends into chaos when it’s scaled across dozens of departments, hundreds of simultaneous projects (or both). Larger organizations need more specialized solutions, and this is the primary driver for seeking good-quality enterprise project management software.
Demands of Resource Allocation
In a large company, employees and resources are often called upon to work on different, competing projects. An SME tool might track time, but it rarely provides a centralized view of resources. This leads to a pervasive problem:
resource starvation or
over-allocation
Stakeholders and team leaders need to see the genuine capacity of every team member and manager across the entire organization, not just within one project board. Failing to manage this leads to:
Burnout
Missed deadlines
Inaccurate budget projections.
Solving this requires better planning through the automated workload-leveling features baked into EPM systems.
Ensuring Strategic Alignment and Governance Targets are Met
Every project undertaken by a business must directly contribute to the company’s strategic, long-term goals. With no governance framework, projects can stall. It’s a common failure when scaling up project tracking tools. Robust enterprise project management software must govern processes and connect tasks to objectives, enabling executives to determine whether deadlines can be met easily.
Security and Compliance
For large corporations, security is non-negotiable. Data requirements, industry-specific compliance standards (like GDPR), and authentication are mandatory. Integrating a new tool means scrutinizing how it handles confidential data; for instance, it might introduce security gaps that an IT department can’t handle. For organizations already using Google Workspace, the ideal enterprise project management software should have the same high level of security and compliance mandated by Google. We’ve seen the challenges faced by companies that don’t use the right PMS; now, let's look at how projects can be well-managed with the right EPM tools.
Managing Multiple Projects and Corporate Governance
For executives and project managers, the fundamental question is not what individual tasks are being completed, but how the entire portfolio of projects is performing against corporate strategy. This shift in perspective from tasks to strategic outcomes is where real enterprise-level functionality becomes indispensable. Teams need a single source of truth to ensure predictable outcomes and minimize risk.
Professional enterprise-level project management software solutions facilitate resource leveling. This means that shared resources are not over-allocated to competing projects. In doing so, team leaders can make informed decisions such as rearranging workloads to prevent team burnout or optimizing people’s roles. This approach is a hallmark of sophisticated EPM solutions.
Key Features of Enterprise Project Management Software
There is a checklist of non-negotiable features in enterprise project management software. Without these, scalability, security, and strategic alignment are difficult to achieve. Here are the essential features that define enterprise-grade PM tools.
Advanced Security and Single Sign-On
Enterprise security is paramount. EPM tools must offer robust authentication mechanisms, including single sign-on support with leading identity providers. This ensures centralized user management, enforced security policies, and simplifies access for thousands of employees. Beyond this, data encryption and compliance with global standards (GDPR, SOC2/ISO 27001) are mandatory. Organizations must be able to trust their EPM solution with sensitive project data.
Comprehensive Project Management
EPM software must provide tools for managing multiple projects. Leaders can then oversee numerous projects simultaneously, gaining a bird's-eye view of progress, budgets, and strategic alignment. Equally vital is proper resource capacity planning and workload management. These are the cornerstones of effective project management software for enterprise environments.
Customizable Reporting
Executives and PMO leaders require real-time, actionable insights, not static reports. Enterprise solutions offer highly customizable dashboards that can pull data from various projects. This enables dynamic reporting on key performance indicators (KPIs), including budget variance, project health, resource utilization, and strategic goal achievement. The ability to tailor reports to different stakeholders, from project managers to the C-suite, is crucial for informed decision-making and transparent corporate governance.
Automated Workflows and Process Standardization
Large enterprises thrive on standardized processes. EPM tools should facilitate the creation of automated workflows for routine tasks, approvals, and notifications. It’ll boost efficiency and also enforce best practices, reduce human error, and ensure consistency across diverse teams. Templating capabilities for common project types are essential for quick deployment.
Scalability and Performance
An enterprise solution must handle thousands of users, millions of tasks, and terabytes of data without performance degradation. It needs to be designed for continuous operation and rapid growth, seamlessly accommodating new teams and projects. Cloud-based solutions are often preferred for their reliability.
Better Google Workspace or Microsoft 365 Integration
For enterprises already running on Google Workspace or Microsoft, native integration is needed. It means having seamless connectivity with Google Drive/SharePoint for document management, Google Calendar for scheduling, and Gmail/Outlook for communication. A truly integrated solution ensures that employees operate within a familiar ecosystem. It enhances collaboration and streamlines workflows, which is critical for efficient project delivery in large teams.
Visual tools for portfolio and resource management
Customizable reporting using the Google ecosystem
Google Workspace/Microsoft integration
Its native design within Google Workspace also provides a distinct advantage, making it a powerful Google Workspace EPM tool.
Competitor Reviews: Where Kanbanchi Outperforms Traditional EPM Tools
When searching for the best enterprise project management software, large organizations often begin by evaluating market leaders. While competitors like Wrike, Smartsheet, ClickUp, and Asana are undeniably powerful, they pose challenges when deployed in a Google Workspace-centric enterprise. They’re great tools, but weren’t built natively for the Google ecosystem, creating administrative and user adoption challenges.
Feature
Kanbanchi
Asana
Monday.com
Wrike
Client Portals
Via Shared Boards
Via Guest Access
✓
✓
Time Tracking
✓
Third-party
✓
✓
Budget & Billing
✓
Third-party
Third-party
Add-on
Google Workspace Integration
✓ Native
Integration
Integration
Integration
Microsoft Integration
✓
Integration
Integration
Integration
Gantt Charts
✓
✓
✓
✓
Resource Management
✓
✓
✓
✓
Customizable Templates
✓
✓
✓
✓
Real-time Collaboration
✓
✓
✓
✓
Consulting-specific Templates
✓
✓
✓
✓
The differences boil down to three critical areas for Google Workspace users:
Cost and licensing models
Integration with Google Workspace
Project visualization
1. Cost and Licensing Models
EPMs operate on complex custom-priced licensing models. For a large organization needing thousands of seats, costs can quickly escalate. Furthermore, these platforms often bundle essential features such as advanced security (SSO) or portfolio views into their highest-tier, most expensive plans.
Traditional EPM Tools
Pricing is generally tiered, with essential EPM features restricted to the highest, often custom-quoted, Enterprise levels. Integrating with Google Workspace often requires additional, paid third-party connectors, adding to the cost.
The Kanbanchi Difference
Kanbanchi offers a clear, cost-effective structure designed for scale, and because it operates within the Google Workspace platform, its licensing is streamlined. This makes it an incredibly attractive alternative for organizations seeking advanced features like Multi-Board views and resource management without the pricing structure of the major competitors. It delivers an excellent return on investment by leveraging a company's existing Google Workspace subscription.
2. Integration with Google Workspace
The degree of integration is the most critical differentiator for organizations already reliant on Google Drive, Gmail, and Calendar. Non-native tools, by definition, must connect to the Google ecosystem using external connectors or APIs.
Traditional EPM Tools
Integration with Google apps is functional but rarely seamless! Attaching a Google Drive file might involve pop-ups, authentication requests, or manual linking. This fragmented experience slows down users and often introduces administrative complexity for IT teams. Furthermore, IT departments must manage data security across multiple disconnected cloud environments.
The Kanbanchi Difference
Kanbanchi is the seamless solution. It functions as an integrated application within Google Workspace. Attaching a file from Drive is instant and native, collaboration via Google Chat is effortless, and scheduling via Calendar is instantaneous. This eliminates the learning curve and greatly boosts user adoption, a critical factor in successful enterprise software rollout. Employees are already familiar with the interface's foundational elements, reducing training costs and increasing productivity from day one.
3. Project Visualisation
Effective project managers need flexibility in how they visualize work. They need a simple Kanban board for daily tasks, a Gantt chart for timeline management, and a Table view for bulk data entry and reporting. Many competitors require purchasing separate add-ons or moving between distinct product interfaces to achieve this view diversity.
Traditional EPM Tools
While most offer Kanban and Gantt views, they are often distinct interfaces. Switching between them can be clunky, and data may not flow smoothly across all views. This separation creates a disjointed user experience.
Kanbanchi’s 3-in-1 View
Kanbanchi provides a powerful, fluid 3-in-1 visualization of Kanban, Gantt, and Table all within a single project board. This seamless transition ensures that resource allocation and schedule dependencies visualized in the Gantt chart are instantly reflected in the task-based Kanban view. The holistic visual management is vital for project managers overseeing dynamic, cross-functional teams and is central to its strength as an EPM solution. Kanbanchi offers a simplified, consolidated, and natively secure experience tailored specifically for organizations that prioritize the Google Workspace environment. It delivers the required EPM power of:
project portfolio management
centralized resource allocation
robust governance
Without the administrative friction and excessive cost associated with other platforms!
Kanbanchi is the Best Enterprise Project Management Software for Google Workspace
For organizations deeply integrated into the Google Workspace ecosystem, selecting the best enterprise project management software means it must enhance, not hinder, their existing workflows. Kanbanchi’s core value is in its native, deep integration that transforms the familiar Google environment into a powerful EPM engine. This familiarity is a significant driver of success in large enterprises. When a new system is introduced, the learning curve often dictates adoption rates. Kanbanchi’s interface is intuitive and aligned with the look and feel of Google products, user training is minimal, and adoption is rapid. Teams spend less time learning a new tool and more time executing projects.
Example of Kanbanchi board used to manage different types of projects
Kanbanchi is engineered to handle the needs of large, complex organizations while maintaining the simplicity Google Workspace users expect:
Seamless Data Integration: Attaching documents, spreadsheets, or presentations from Google Drive is not an import; it is a direct, native link. This ensures permissions are managed through Drive, guaranteeing consistent security and preventing the creation of redundant files in the cloud.
Enterprise-Grade Security and IT Control: Kanbanchi supports advanced security features crucial for large organizations, including Single Sign-On (SSO) and stringent user access control. Since the application runs on Google Cloud infrastructure, it leverages Google’s robust, industry-leading security and compliance standards, satisfying IT governance requirements without introducing new security vulnerabilities.
This means that Kanbanchi is a leading Google Workspace EPM tool and one of the most scalable, secure, and user-friendly solutions for managing complex project portfolios. With this in mind, here’s an idea of how you can scale your project workflow with Kanbanchi.
Step-by-Step: Scaling Project Workflows Across Your Organization
Successfully rolling out new top enterprise project management software across a large organization requires a structured approach. So, here is an actionable three-step guide for implementing and scaling your project workflows with Kanbanchi:
Step 1: Centralize your IT Setup for Security and Governance
The priority is ensuring security and control. For a large enterprise, this means centralized IT configuration.
Configure Single Sign-On (SSO): Integrate Kanbanchi with your organization’s identity provider (e.g., Google Workspace Identity). This centralizes user management, enforces access policies, and ensures that only authorized personnel can access sensitive project data.
Establish User Access Roles: Define granular permissions for users, including PMO leaders, project managers, and team members. This ensures that governance standards are upheld and critical data remains secure. This centralized control is essential for any EPM solution.
Step 2: Standardize Templates Across Departments
Standardization is the bedrock of efficient project portfolio management. Using standardized templates across departments ensures that data is collected consistently, making aggregation and reporting accurate.
Create Departmental Templates: Develop pre-configured Kanbanchi board templates for common project types, such as IT deployments, HR onboarding, and marketing content pipelines.
Define Standardized Fields: Ensure all templates use the same custom fields for key data points (e.g., Priority, Budgeted Hours, Status). This uniformity allows the PMO to reliably compare performance metrics across disparate projects.
Step 3: Rollup Reporting with Kanbanchi Data Export
The final step is leveraging the data for executive reporting. The PMO can transform decentralized project data into centralized, easily viewable, and easy-to-digest strategic insights.
Implement Auto Export and Set Up Dashboards: Teach PMO users how to set it up. Then use Google Looker or Power BI to set up the reports that your company needs. Check out this guide for more details: "How to create a project management dashboard? Integrating Kanbanchi with Power BI and Google Looker for advanced reporting."
By following this standardized, IT-governed rollout, large companies can rapidly transition to using Kanbanchi as their trusted Google Workspace EPM tool, maximizing both adoption and strategic oversight.
Strategic Control for the Google Workspace Enterprise
Choosing the best enterprise project management software is a high-stakes strategic decision, especially for large organizations that depend on predictable execution and transparent governance. Particularly for companies operating on Google Workspace, Kanbanchi provides an integrated, scalable, and secure alternative.
By delivering enterprise-grade features, such as multiple projects oversight, centralized resource allocation, and robust security (SSO) natively within the Google ecosystem, Kanbanchi eliminates the learning curve and IT headaches associated with third-party connectors. It transforms your Google Workspace investment into a powerful EPM solution.
For PMO leaders and IT executives seeking a platform that maximizes efficiency, ensures compliance with corporate governance requirements, and drives high user adoption across all departments, Kanbanchi is the definitive choice.
Ready to chat about taking the following steps with professional enterprise management software for your corporation? Great! We’d love to get the conversation started.
Get in touch with us right now, and we’d be happy to discuss your requirements.
28. How to Import Projects from Trello, Asana, Monday, Jira, and Other Tools to Kanbanchi - Project Management Migration Guide
Project teams today frequently outgrow their current project management migration tools, seeking better integration, enhanced features, or more cost-effective solutions. Whether you're experiencing limitations with Trello's basic structure, Asana's pricing model, or Monday.com's complexity, migrating to Kanbanchi offers a seamless path to enhanced productivity. This comprehensive guide covers everything you need to import from Trello, import from Asana, import from Monday, and migrate from other popular project migration platforms to Kanbanchi's powerful Google Workspace-integrated environment.
Example of the development team board in Kanbanchi
Kanbanchi stands out as a unique Trello alternative that combines visual project management with deep Google Workspace integration. Unlike other tools that require separate logins and data silos, Kanbanchi stores your project boards directly in your Google Drive, ensuring security and accessibility while maintaining the familiar Google ecosystem experience. This guide will walk you through step-by-step migration processes, troubleshooting techniques, and optimization strategies to ensure a successful transition.
Why Teams Migrate to Kanbanchi from Other Project Management Tools
Organizations migrate project management tools for various compelling reasons, with Google Workspace integration being the primary driver. Teams using Google's ecosystem need seamless connectivity between their productivity tools and project management platform. Kanbanchi's native integration with Google Drive, Gmail, Calendar, and Forms eliminates the friction of switching between different applications and maintaining multiple login credentials.
Cost effectiveness represents another significant migration factor. While competitors often increase pricing as teams grow, Kanbanchi offers transparent pricing starting at $3.97 per user per month with educational discounts of 25% for qualifying institutions. This pricing structure makes it particularly attractive for budget-conscious organizations seeking enterprise-level features without premium costs.
The visual project management approach resonates strongly with teams transitioning from traditional task lists to more intuitive workflows. Kanbanchi's implementation goes beyond basic Kanban boards, offering integrated Gantt charts, time tracking, and comprehensive reporting all within a single interface. This eliminates the need for multiple subscriptions to different project management tools.
Enhanced collaboration capabilities drive teams to switch from Trello and other platforms. Kanbanchi enables real-time collaboration with comment threads, file attachments from Google Drive, and automated notifications. Unlike Trello's limited free tier or Asana's user restrictions, Kanbanchi offers unlimited collaborators, even on its basic plans, making it ideal for growing teams.
Recent surveys indicate that 73% of organizations plan to switch project management tools within the next two years, primarily due to inadequate integration with their existing tech stack. Kanbanchi addresses this challenge by functioning as a native Google Workspace application, rather than an external service that requires complex integrations.
Pre-Migration Checklist: What You Need Before Starting
Successful project management migration requires thorough preparation to minimize disruption and ensure data migration tools preserve all critical information. Before initiating any migration process, teams must complete a comprehensive audit of their current project management setup.
Data inventory and backup forms the foundation of migration planning. Export all boards, cards, attachments, and user permissions from your current platform before beginning the transition. Most project data migration failures occur due to incomplete backups or missing dependencies. Create multiple backup formats, including JSON exports, CSV files, and screenshot documentation of complex board structures.
Team communication and training ensures smooth adoption of the new platform. Schedule training sessions for key team members and establish a timeline that allows for parallel operation during the transition period. Users familiar with Trello, Asana, or Monday.com will find Kanbanchi's interface intuitive, but allowing time for exploration prevents resistance to change.
Access permissions and security require careful mapping before migration. Document current user roles, board permissions, and sharing settings. Kanbanchi inherits Google Drive permissions, which may differ from your current tool's permission structure. Plan how external collaborators will gain access through Google accounts or guest permissions.
Integration dependencies must be identified and addressed. Catalog all current integrations with tools like Slack, Microsoft Teams, or custom applications. While Kanbanchi offers robust Google Workspace integration, third-party connections may require reconfiguration or alternative solutions.
Timeline and resource allocation prevents migration-related disruptions. Establish realistic timeframes based on project volume and team size. Small teams can typically complete migration in 1-2 days, while enterprise implementations may require 2-4 weeks for proper testing and optimization.
Advanced Migration Techniques and Data Preservation
Project migration success often depends on preserving complex data relationships and historical information that standard imports might not capture. Advanced techniques ensure that comprehensive data migration tools maintain project continuity while maximizing Kanbanchi's capabilities.
Preserving Project History
While basic CSV imports transfer current task states, preserving project history requires additional strategies. Export activity logs, comment threads, and change histories as supplementary documentation. Consider creating dedicated archive boards in Kanbanchi for historical reference, using card descriptions to capture timeline information and decision points.
Attachment and File Management
Large file collections require systematic migration planning. Kanbanchi's Google Drive integration provides advantages for file management, but attachment migration from other platforms needs careful handling. Download all attachments locally, then re-upload to Google Drive for seamless integration with Kanbanchi boards.
Complex Relationship Preservation
Dependencies, subtasks, and cross-project relationships may not transfer through standard CSV imports. Document these relationships manually and recreate them using Kanbanchi's card linking features and dependency tracking capabilities. The platform's subcards functionality can effectively recreate hierarchical task structures from more complex source systems.
API-Based Migration Solutions
For enterprise-scale migrations requiring custom development, Kanbanchi's API capabilities enable sophisticated project data migration scenarios. Organizations with technical resources can develop custom scripts that preserve intricate data relationships while automating the migration process for multiple projects simultaneously.
Data Integrity Verification
Implement systematic verification processes to ensure migration accuracy. Create checklists comparing source and destination data, verify user assignments, and confirm that all critical attachments and comments transferred successfully. This verification step is crucial for maintaining project management migration integrity.
Rollback and Recovery Planning
Maintain source platform access during initial migration phases to enable rollback if issues arise. Export comprehensive backups before initiating migration and establish clear rollback procedures. This safety net ensures that migrating project management tools initiatives can recover quickly from unexpected challenges.
How to Import from Trello to Kanbanchi
Import from Trello to Kanbanchi through a streamlined process designed to preserve all board structures, cards, and attachments. Kanbanchi's direct Trello import functionality ensures comprehensive project data migration while maintaining organizational workflows.
Step 1: Export Your Trello Data
Navigate to your Trello board and access the Board Menu. Select "More" followed by "Print and Export," then choose "Export JSON." This generates a comprehensive file containing all board data, including cards, lists, labels, due dates, and attachments. Save this JSON file to your computer or Google Drive for easy access during the import process.
Step 2: Prepare for Import
Sign in to Kanbanchi using your Google account. The platform's Google Workspace integration eliminates the need for separate credentials, ensuring that your migrated boards remain secure within your Google Drive ecosystem.
Step 3: Execute the Import Process
From the Kanbanchi dashboard, select "Import Your Trello Board" option. Upload the JSON file exported from Trello, either from your computer or directly from Google Drive. Kanbanchi automatically processes the file structure and creates corresponding boards, preserving the card hierarchy and content.
Step 4: Verify Migration Accuracy
Review the imported board to ensure all cards, lists, and attachments transferred correctly. Kanbanchi maintains Trello's visual structure while adding enhanced features, such as integrated time tracking and Gantt chart views. Verify that due dates, card assignments, and labels are displayed accurately.
Step 5: Optimize and Customize
Take advantage of Kanbanchi's advanced features, which are not available in Trello. Configure Google Calendar integration for deadline tracking, set up automated email notifications, and explore the built-in reporting capabilities. The Trello alternative offers superior collaboration tools, including real-time commenting and file sharing through Google Drive.
For teams managing multiple Trello boards, repeat this process for each board or contact Kanbanchi support for bulk migration assistance. The platform's customer service has received praise for responsive support during migration projects.
How to Import from Asana to Kanbanchi
Import from Asana requires a different approach since Kanbanchi doesn't offer direct Asana connectivity. However, the CSV import functionality provides an effective migration path for project data migration while preserving essential task information and project structures.
Step 1: Export Asana Data to CSV
Access your Asana project and navigate to the export options. Generate a CSV export that includes all tasks, assignees, due dates, project sections, and custom fields. Asana's CSV export provides comprehensive data that translates well to Kanbanchi's board structure.
Step 2: Prepare CSV for Kanbanchi Import
Review the exported CSV file to ensure proper UTF-8 encoding, as Kanbanchi only supports this format. The CSV should include columns for task names, descriptions, assignees, due dates, and project sections. Kanbanchi provides a template spreadsheet to guide proper formatting for optimal import results.
Step 3: Execute CSV Import
In Kanbanchi, select "Import board from" and choose the CSV option. Upload your prepared file, and Kanbanchi will create a new board using the imported data. The platform automatically maps CSV columns to corresponding card fields, creating an organized board structure.
Step 4: Map Custom Fields and Sections
Asana alternative features in Kanbanchi may handle certain Asana-specific elements differently. Review how custom fields, project sections, and subtasks appear in the new environment. Kanbanchi's card structure accommodates most Asana data types while offering additional functionality like Google Drive file attachments.
Step 5: Configure Team Access and Permissions
Migrate team member access by sharing the imported board with relevant collaborators. Kanbanchi's Google Workspace integration simplifies this process, as users can access boards through their existing Google accounts without additional setup requirements.
Step 6: Enhance with Kanbanchi Features
Explore advanced capabilities not available in Asana, including integrated Gantt charts for timeline visualization and comprehensive time tracking. The migrate from asana process opens opportunities for improved project visibility and enhanced Google ecosystem integration.
Consider using Kanbanchi's board templates for future projects, as they provide optimized structures based on common project management methodologies and can significantly accelerate project setup compared to starting from scratch.
How to Import from Jira to Kanbanchi
Import from Jira follows a streamlined XML-based process that preserves issue structures and project hierarchies. Kanbanchi provides dedicated Jira import functionality that handles the platform's complex issue tracking system more effectively than generic CSV approaches.
Step 1: Export Jira Project Data
Log into Jira and navigate to the project you want to migrate. Access Filters and select Advanced issue search to reach the comprehensive search interface. Click Export and choose Export XML to generate a complete data export including all issues, custom fields, and project metadata.
Step 2: Save XML File
The exported data opens in a new browser tab displaying XML format content. Right-click and select Save as... to download the file to your computer. For complex boards with extensive customization, you may need to first select View page source before saving to ensure complete data capture.
Step 3: Import to Kanbanchi
From your Kanbanchi boards list, locate the Import board from option and select Jira. Upload the saved XML file, and Kanbanchi automatically processes the Jira data structure to create a new board with preserved issue information, assignees, and project organization.
Jira-Specific Advantages
Unlike CSV-based migrations, Jira's XML export maintains issue relationships, epic structures, and sprint information that translate effectively to Kanbanchi's board organization. This direct import method ensures project data migration preserves Jira's sophisticated issue tracking while gaining Kanbanchi's Google Workspace integration benefits.
Importing from Monday.com, Wrike, ClickUp, and Other Project Management Tools
Migrating project management tools beyond the major platforms requires adaptable strategies that accommodate diverse data formats and feature sets. The universal CSV approach serves as the most reliable method for importing projects from Wrike, ClickUp, Basecamp, and other platforms to Kanbanchi.
Universal CSV Migration Strategy
Most professional project management platforms provide CSV export capabilities. This standardized format ensures data migration tools can process information regardless of source platform complexity. Export all critical data, including task names, descriptions, assignees, due dates, project categories, and status information.
Data Cleaning and Standardization
Different platforms organize data uniquely, requiring standardization before import. ClickUp's hierarchy of spaces, folders, lists, and tasks may need flattening into Kanbanchi's board and card structure. Wrike's folder-based organization translates well to Kanbanchi's board categories, while maintaining task relationships through clear naming conventions.
Field Mapping Techniques
Create mapping documents that translate source platform fields to Kanbanchi equivalents. Common mappings include status columns to list names, priority levels to labels, and custom fields to card descriptions or comments. This systematic approach ensures import project data maintains essential context and functionality.
Batch Processing for Large Migrations
Enterprise-scale migrations may require multiple CSV imports to avoid overwhelming the system. Process data in logical groups such as by department, project type, or time period. Kanbanchi's import system handles individual files efficiently while maintaining data integrity across multiple imports.
Integration Bridge Solutions
Some platforms offer integration bridges or third-party migration tools that can facilitate project migration. While Kanbanchi's direct import options focus on Trello and CSV, API-based solutions may be available for complex enterprise migrations requiring preservation of advanced relationships and custom data types.
Testing and Validation
Always test migration processes with sample data before full implementation. Create test boards using subsets of your source data to verify field mapping accuracy and identify potential issues. This validation step prevents data loss and ensures successful switch project management tool outcomes.
Post-Migration Setup: Optimizing Your Kanbanchi Workspace
Migrating to Kanbanchi successfully extends beyond data transfer to encompass workspace optimization and team adoption. Proper post-migration configuration maximizes the platform's Google Workspace integration advantages while establishing productive workflows.
Google Workspace Integration Configuration
Activate all relevant Google integrations to maximize productivity gains. Configure Gmail integration for email-to-task conversion, connect Google Calendar for deadline synchronization, and establish Google Forms integration for task creation workflows. These connections transform Kanbanchi from a simple project tool into a comprehensive workspace hub.
Board Template Creation
Develop standardized board templates based on successful migration outcomes and organizational needs. Templates accelerate project creation while ensuring consistency across teams. Include predefined card structures, label systems, and workflow stages that reflect proven methodologies from previous platforms.
Notification and Communication Setup
Configure notification preferences to balance information sharing with communication overload. Kanbanchi's flexible notification system allows customization by board, card, or user preference. Establish team guidelines for comment usage, @mentions, and email notifications to maintain productive collaboration patterns.
Reporting and Analytics Implementation
Leverage Kanbanchi's Google Sheets integration for advanced reporting capabilities. Create automated reports that track project progress, team productivity, and milestone achievement. These analytics often provide superior insights compared to previous platforms, especially for organizations using Google's ecosystem extensively.
User Training and Adoption Programs
Implement structured training programs that highlight Kanbanchi's unique advantages rather than simply explaining basic functionality. Focus on Google Workspace integration benefits, advanced features like Gantt charts, and productivity improvements enabled by the platform's design philosophy.
Security and Permission Optimization
Review and optimize board permissions using Google Drive's inherited permission system. This security model provides more granular control than many previous platforms while maintaining simplicity through familiar Google account management. Establish clear guidelines for external collaborator access and board sharing protocols.
Common Migration Issues and How to Solve Them
Project management migration challenges require systematic troubleshooting approaches to ensure successful platform transitions. Understanding common issues and solutions accelerates migration timelines while preventing data loss or team disruption.
CSV Import Format Errors
UTF-8 encoding requirements cause the most frequent import failures. Source platforms may export CSV files in different encodings that Kanbanchi cannot process. Solution: Use text editors or spreadsheet applications to convert files to UTF-8 encoding before import. Verify character encoding in Excel by saving as "CSV UTF-8" format.
Data Field Mapping Problems
Complex source platforms often include custom fields that don't directly translate to Kanbanchi's structure. Solution: Simplify data before import by consolidating custom fields into descriptions or comments. Create mapping documents that establish consistent translation rules for recurring custom field types.
User Assignment and Permission Issues
Team member assignments may not transfer correctly if users lack Google accounts or appropriate board access. Solution: Create Google accounts for all team members before migration, or plan for manual assignment correction post-import. Utilize Kanbanchi's inherited Google Drive permissions for streamlined access management.
Large File and Attachment Problems
Attachment limits and file size restrictions can prevent successful migration. Solution: Upload large files to Google Drive manually and link them to cards rather than embedding them directly. Kanbanchi's Google Drive integration provides unlimited storage through your Google Workspace allocation.
Timeline and Date Conversion Errors
Date formats from different platforms may not import correctly into Kanbanchi. Solution: Standardize all dates to YYYY-MM-DD format before CSV import. Review imported cards to verify date accuracy and manually correct any conversion errors.
Board Structure and Workflow Disruption
Complex board hierarchies may not translate directly to Kanbanchi's structure. Solution: Simplify board organization during migration, focusing on essential workflow stages. Use Kanbanchi's swimlanes feature to recreate complex categorizations without overwhelming the interface.
Performance and Loading Issues
Large imports may cause temporary performance issues or timeouts. Solution: Break large datasets into smaller batches for import. Process boards individually rather than attempting bulk imports of entire workspaces.
Migration Checklist and Timeline Template
Import projects successfully requires systematic planning and execution following proven timelines and verification procedures. This comprehensive checklist ensures project data migration maintains quality while minimizing business disruption.
Pre-Migration Phase (Week 1-2)
Complete data audit and inventory
Export all boards, attachments, and user lists
Create comprehensive backups in multiple formats
Establish Google accounts for all team members
Schedule team training sessions
Set up Kanbanchi workspace and initial boards
Migration Execution Phase (Week 2-3)
Import high-priority boards first
Verify data accuracy for each imported board
Configure Google Workspace integrations
Set up board templates and standardized workflows
Test notification and permission systems
Migrate file attachments to Google Drive
Post-Migration Optimization (Week 3-4)
Conduct team training on Kanbanchi features
Optimize board templates and workflows
Configure reporting and analytics systems
Establish ongoing maintenance procedures
Decommission old platform access
Document migration outcomes and lessons learned
Timeline Recommendations by Team Size Small teams (1-10 users): 1-2 weeks total Medium teams (11-50 users): 2-3 weeks total Large teams (50+ users): 3-4 weeks total Enterprise implementations: 4-8 weeks, depending on complexity
Success Metrics and Verification Measure migration success through user adoption rates, task completion efficiency, and team satisfaction surveys. Track metrics such as time-to-task-creation, collaboration frequency, and integration usage to validate the benefits of migrating to Kanbanchi.
Why Kanbanchi is the Best Destination for Your Project Migration
Migrating to kanbanchi represents a strategic decision that positions teams for enhanced productivity through superior Google Workspace integration and comprehensive project management capabilities. The platform's unique advantages extend far beyond basic task management to encompass enterprise-level functionality at accessible pricing points.
Native Google Ecosystem Integration
Unlike competitors requiring complex third-party integrations, Kanbanchi functions as a native Google Workspace application. Boards store directly in Google Drive, ensuring enterprise-grade security while maintaining familiar access patterns. This integration eliminates the authentication fatigue and data silos familiar with external project management platforms.
Comprehensive Feature Set Without Complexity
Kanbanchi combines visual Kanban boards with advanced features including Gantt charts, time tracking, and comprehensive reporting within an intuitive interface. Teams gain enterprise functionality without the learning curve associated with complex platforms like Monday.com or the feature limitations of simpler tools like Trello.
Transparent and Scalable Pricing
Starting at $3.97 per user per month, Kanbanchi provides exceptional value compared to competitors. Educational institutions and non-profits receive 25% discounts, making enterprise-level project management accessible to budget-conscious organizations. The pricing structure scales naturally without surprise fees or feature restrictions.
Superior Migration Support
Kanbanchi import capabilities streamline transitions from major platforms while maintaining data integrity. The platform's customer support consistently receives praise for its migration assistance, ensuring teams experience minimal disruption during platform transitions. Free trials enable a comprehensive evaluation before making a commitment.
Future-Proof Google Integration
Google's continued ecosystem expansion ensures Kanbanchi users benefit from ongoing innovation without platform migrations. Integration with emerging Google Workspace features happens automatically, providing long-term value and reducing the likelihood of future switch to project management tools decisions.
Organizations choosing Kanbanchi join a growing community of teams leveraging Google's ecosystem for enhanced productivity and collaboration. The platform's combination of powerful features, intuitive design, and deep integration capabilities makes it the ideal destination for teams ready to optimize their project management workflows within the Google environment they already know and trust.
Want to join the family of happy Kanbanchi clients?
29. How to Store and Manage Project Assets in Google Drive with Kanbanchi
Managing project assets effectively remains one of the biggest challenges facing modern teams. With files scattered across multiple platforms, version control issues, and collaboration bottlenecks, teams often waste valuable time searching for documents instead of focusing on their core work.
Google Drive project management has emerged as a powerful solution for teams seeking centralized storage and seamless collaboration. When combined with Kanbanchi's intuitive project management capabilities, organizations can transform their chaotic file management into a streamlined, efficient system.
The integration of project files management with visual project boards creates a unified workspace where every team member knows exactly where to find what they need. This comprehensive guide will show you how to leverage Google Drive integration with Kanbanchi to create a robust project asset management system that scales with your team's needs.
Kanbanchi board with task cards organized in columns, showing statuses, labels, deadlines, and assigned users
Understanding Project Asset Management in Google Drive
Project assets encompass all digital materials created, collected, or used throughout a project's lifecycle. These include documents, spreadsheets, presentations, images, videos, design files, contracts, and any other resources that contribute to project completion.
Effective asset management ensures that team members can quickly locate resources, maintain version control, and collaborate seamlessly. Without proper organization, teams spend up to 20% of their time searching for information, according to recent productivity studies.
The challenges teams face without organized file storage are significant:
Poor version control leads to confusion about which document version is current. Team members accidentally work on outdated files, creating duplicated effort and potential errors. Email attachments multiply file versions, making it nearly impossible to maintain a single source of truth.
Access control issues prevent the right people from finding the necessary resources when they need them. Critical project files become buried in personal folders or shared drives without proper permissions. New team members struggle to understand existing file structures and naming conventions.
Collaboration bottlenecks emerge when multiple team members need to work on the same resources simultaneously. Traditional file storage solutions often lack real-time collaboration features, forcing teams to work in silos and merge changes manually.
Google Drive addresses these challenges through several key capabilities:
Cloud-based accessibility ensures team members can access project assets from anywhere, on any device. Real-time collaboration features allow multiple users to work simultaneously on documents, spreadsheets, and presentations without version conflicts.
Robust sharing controls enable project managers to set appropriate permissions for different team members and stakeholders. Advanced search functionality helps locate specific files quickly, even within large project repositories.
Google Drive storage integrates seamlessly with other Google Workspace tools, creating a cohesive ecosystem for project work. Automatic syncing ensures that changes are saved and distributed immediately across all team members.
Benefits of Using Kanbanchi with Google Drive for Project Assets
The integration of Kanbanchi with Google Drive creates a powerful project asset management system that addresses common workflow challenges. This combination leverages the strengths of both platforms to deliver a unified project management experience.
Kanbanchi works seamlessly within the Google Workspace ecosystem, eliminating the need to switch between different applications. Team members can attach Google Drive files directly to project cards, maintaining context and reducing the risk of losing important documents.
The integration automatically syncs with Google Calendar, ensuring that project deadlines and asset delivery dates are aligned across all team members. Real-time notifications keep everyone informed about file updates and project progress without overwhelming their workflows.
Automatic File Synchronization
Changes made to Google Drive files are instantly reflected in associated Kanbanchi cards. This eliminates confusion about which version of a document is current and ensures that all team members are working with the latest information.
File attachments maintain their connection to the source documents in Google Drive, preserving the collaborative editing capabilities while keeping project context intact. Team members can edit files directly from Kanbanchi cards without losing their place in the project workflow.
Enhanced Search and Organization Capabilities
Kanbanchi's project structure, combined with Google Drive's powerful search functionality, creates multiple pathways for locating project assets. Team members can find files through project boards, card attachments, or direct Google Drive searches.
Custom labels and tags within Kanbanchi complement Google Drive's folder structure, providing additional organizational layers. This dual approach accommodates different working styles and makes it easier for team members to locate resources using their preferred methods.
Real-Time Collaboration Features
Visual project boards in Kanbanchi show the status of all project assets at a glance. Team members can see which files are in progress, awaiting review, or completed, reducing the need for status meetings and email updates.
Comments and discussions within Kanbanchi cards maintain context around specific files and decisions. This creates a project history that helps future team members understand the reasoning behind asset choices and modifications.
Version Control and Access Management
Google Drive's native version history combines with Kanbanchi's project timeline to create comprehensive audit trails. Project managers can track not only what changes were made to files but also how those changes affected project progress.
Permission management through Google Drive ensures that sensitive project assets remain secure while still being accessible to authorized team members. Kanbanchi respects these permissions, maintaining security protocols without sacrificing usability.
Security and Compliance Benefits
Enterprise-grade security features from Google Workspace extend to project assets managed through Kanbanchi. This includes data encryption, access logging, and compliance with industry standards such as GDPR and HIPAA.
Centralized asset storage in Google Drive reduces the risk of data loss from local storage failures or employee turnover. Automatic backups and Google's infrastructure reliability provide additional protection for critical project resources.
Setting Up Your Project Asset Management System
Creating an effective project asset management system requires careful planning and systematic implementation. The following steps will guide you through establishing a robust foundation that scales with your team's needs.
Create a dedicated folder in Google Drive for your project, using a clear naming convention that includes the project name and year. For example: "2025 Website Redesign Project Assets" or "Marketing Campaign Q1 2025 Files."
Within the master folder, create standardized subfolders that reflect your team's workflow stages. Common subfolder structures include: "01 Planning Documents," "02 Design Assets," "03 Content Materials," "04 Review Feedback," and "05 Final Deliverables."
Step 2: Implement Consistent Naming Conventions
Develop file naming standards that include relevant information such as date, version number, and content type. For example: "2025-01-15_BrandGuidelines_v2.3_DRAFT.pdf" provides immediate clarity about the file's content and status.
Create a naming convention guide document within your master folder so all team members follow the same standards. Include examples for different file types and project stages to ensure consistency across the entire project lifecycle.
Setting Up Kanbanchi Project Boards
Step 3: Create Your Project Board Structure
Open Kanbanchi within Google Workspace and create a new board for your project. Design columns that reflect your asset workflow stages, such as "Asset Planning," "In Progress," "Review Required," "Approved," and "Published."
Customize card templates to include standard information fields relevant to your project assets. Common fields include asset type, deadline, assigned team member, review status, and Google Drive files.
Step 4: Establish Card Organization Systems
Create cards for each major asset category or deliverable within your project. Use consistent naming that aligns with your Google Drive folder structure to maintain clarity across both platforms. Add relevant team members to each card based on their roles in asset creation, review, or approval. This ensures that notifications reach the right people at the appropriate times in the workflow.
Connecting Google Drive to Kanbanchi
Step 5: Link Assets to Project Cards
Attach relevant Google Drive files directly to their corresponding Kanbanchi cards. This creates a direct connection between project tasks and their associated resources, eliminating the need to search through folder structures.
Add links to entire folders when multiple files relate to a single project component. This maintains organization while providing quick access to comprehensive asset collections.
Configuring Access Permissions
Step 6: Establish Security Protocols
Review and set appropriate Google Drive sharing permissions for all project folders and files. Ensure that team members have the minimum access level necessary to complete their work while maintaining security protocols.
Create different permission levels for various stakeholder groups. For example, core team members might have edit access, while clients or executives receive view-only permissions for specific asset categories.
Step 7: Document Access Procedures
Create a team access guide that explains how to request permissions for different project assets. Include contact information for project administrators and clear procedures for emergency access situations.
Regularly audit access permissions to ensure that former team members or external collaborators no longer have unnecessary access to project assets. Schedule quarterly reviews to maintain security standards.
Best Practices for Organizing Project Assets
Effective organization systems reduce friction and improve team productivity. These proven strategies help maintain order throughout project lifecycles while accommodating different working styles and team sizes.
Example of a best-practice project folder structure with numbered main and subfolders
File Naming Conventions
Implement a standardized naming structure that includes essential information in a consistent format. Use the pattern: YYYY-MM-DD_ProjectComponent_Version_Status.extension for maximum clarity and searchability.
Include relevant keywords in file names that team members are likely to use when searching. For example, "2025-02-10_Homepage_Wireframe_v3.2_ClientReview.pdf" contains multiple search terms that different team members might use.
Avoid special characters, spaces, and extremely long file names that can cause technical issues across different platforms and devices. Use underscores or hyphens to separate elements within file names for better compatibility.
Folder Structure Strategies
Create hierarchical folder structures that mirror your project workflow and team organization. Main folders should represent major project phases or asset categories, with subfolders providing additional granularity as needed.
Limit folder depth to no more than four levels to prevent navigation complexity. Deep folder structures become difficult to navigate and increase the likelihood of files being saved in incorrect locations.
Use numbered prefixes (01, 02, 03) for folders that should maintain a specific order. This prevents alphabetical sorting from disrupting logical workflow sequences and makes navigation more intuitive.
Version Control Methods
Establish clear version numbering systems that indicate the significance of changes. Use major.minor formatting (v2.1) where major numbers indicate substantial revisions and minor numbers represent incremental updates.
Maintain previous versions in designated archive subfolders rather than deleting them entirely. This provides fallback options if newer versions encounter issues and maintains a complete project history.
Include status indicators in file names (DRAFT, REVIEW, APPROVED, FINAL) to communicate the current state of each asset. This prevents team members from accidentally working on inappropriate versions.
Tagging and Metadata Usage
Leverage Google Drive's built-in description and comment features to add searchable metadata to important files. Include project phases, responsible team members, and key deliverable dates in file descriptions.
Create consistent tagging systems using comments or file descriptions that help categorize assets across multiple dimensions. For example, tag files by department, priority level, or client requirements.
Use Google Drive's color-coding features to distinguish different asset categories or status levels visually. Consistent color schemes help team members quickly identify file types and current states.
Regular Maintenance Routines
Schedule weekly file organization reviews to ensure that new assets are properly categorized and named according to established conventions. Address organizational issues promptly before they compound into larger problems.
Implement monthly archive procedures for completed project phases, moving finished assets to designated archive folders while maintaining access for reference purposes. This keeps active working areas uncluttered.
Conduct quarterly access reviews to update permissions, remove outdated files, and optimize folder structures based on team feedback and usage patterns.
Team Collaboration Guidelines
Establish clear protocols for file sharing and editing that prevent conflicts and maintain asset integrity. Define when to use editing permissions versus commenting permissions based on team member roles and responsibilities.
Create standardized communication procedures for asset updates, including required notification methods and approval processes. Ensure that all team members understand their responsibilities in maintaining organizational standards.
Provide training resources and quick reference guides that help team members understand and follow established organizational systems. Regular reinforcement helps maintain consistency as teams grow and change.
Advanced Tips for Project Asset Management
Power users can leverage advanced features and techniques to maximize efficiency and create sophisticated asset management workflows that adapt to complex project requirements.
Using Google Drive Search Operators
Master advanced search operators to locate files quickly within large project repositories. Use quotation marks for exact phrase searches, such as "brand guidelines" to find files containing that specific term combination.
Leverage file type filters by adding "type:pdf" or "type:image" to searches when looking for specific asset categories. Combine operators using "type:pdf owner:username" to find files created by specific team members.
Use date range operators like "before:2025-01-01" or "after:2025-02-15" to locate files within specific time periods. This is particularly useful for finding recently updated assets or archived materials from previous project phases.
Automation Techniques
Set up Google Drive automation using Google Apps Script to automatically organize files based on naming conventions or metadata. Create scripts that move files to appropriate folders when they're uploaded or modified.
Implement automated backup procedures that create copies of critical project assets at regular intervals. Use Google's built-in version history combined with automated export functions to maintain comprehensive backups.
Integration with Other Google Workspace Tools
Connect Google Sheets with your asset management system to create dynamic project dashboards that track file status, completion rates, and team workload distribution. Use formulas to automatically calculate project progress based on asset completion.
Integrate Google Calendar to create deadline reminders and milestone alerts related to specific project assets. Link calendar events directly to relevant Kanbanchi cards and Google Drive folders for seamless navigation.
Utilize Google Forms for standardized asset review and approval processes, automatically populating responses into Google Sheets for tracking and analysis. This creates consistent feedback loops and maintains approval documentation.
Backup and Recovery Strategies
Implement multi-layered backup approaches that include local downloads of critical assets in addition to Google Drive's native redundancy. Create automated download scripts for essential files that require offline access.
Document recovery procedures that team members can follow if files become corrupted or accidentally deleted. Include step-by-step instructions for accessing version history and restoring previous file versions.
Establish external backup procedures for projects with long-term archival requirements, including periodic exports to secondary cloud storage or local server systems as needed for compliance or security reasons.
Performance Optimization Tips
Optimize large file handling by using Google Drive's streaming features and avoiding unnecessary local synchronization of huge asset libraries. Configure selective sync settings to improve system performance.
Implement file compression strategies for archived assets that maintain accessibility while reducing storage consumption. Use consistent compression standards that preserve file integrity while optimizing storage usage.
Monitor storage usage patterns and implement cleanup procedures that remove duplicate files and outdated versions while maintaining necessary project history and reference materials.
Common Challenges and Solutions
Even well-designed asset management systems encounter predictable challenges. Understanding these common issues and their solutions helps teams maintain productivity and avoid frustrating delays.
Storage Limit Issues
Google Drive storage limits can become constraints for asset-heavy projects involving large media files or extensive documentation. Monitor storage usage regularly through Google Drive's storage management tools to anticipate capacity issues before they impact workflows.
Solution: Implement tiered storage strategies that move completed project assets to archive folders with compressed versions. Maintain working file versions in active storage while archiving full-resolution assets in secondary locations.
Optimize file formats for storage efficiency without compromising quality. Convert oversized images to appropriate web formats and use Google's built-in compression for documents and presentations while preserving editability.
Access Control Problems
Permission conflicts arise when team members cannot access necessary files or when unauthorized users gain inappropriate access levels. These issues typically stem from inconsistent sharing practices or inadequate permission reviews.
Solution: Establish standardized permission templates for different roles and project phases. Create documented procedures for granting and revoking access that all team members can follow consistently.
Implement regular permission audits using Google Drive's sharing reports to identify potential security issues or access gaps. Schedule monthly reviews during active projects and quarterly reviews for ongoing initiatives.
Version Conflicts
Multiple team members working on the same assets can create version conflicts, especially when offline editing occurs or when files are downloaded and re-uploaded rather than edited directly in Google Drive.
Solution: Emphasize cloud-based editing workflows that leverage Google Drive's real-time collaboration features. Train team members to work directly within Google Drive rather than downloading files for local editing.
Establish clear checkout procedures for files that require exclusive editing access. Use Kanbanchi card assignments and comments to communicate when files are being actively modified by specific team members.
Search Difficulties
Large project repositories can become difficult to navigate, especially when files accumulate over time and naming conventions aren't consistently applied. Team members waste time searching for assets instead of focusing on productive work.
Solution: Implement consistent metadata practices that make files discoverable through multiple search approaches. Use file descriptions, comments, and folder structures that support different search strategies.
Create searchable project indexes within Google Sheets that catalog major assets with descriptions, locations, and responsible team members. Link these sheets to Kanbanchi boards for easy reference.
Collaboration Bottlenecks
Review and approval processes can create delays when multiple stakeholders need to provide input on project assets. Traditional email-based review cycles often result in lost feedback and unclear approval status.
Solution: Establish structured review workflows within Kanbanchi that clearly define approval stages and responsible parties. Use card assignments and due dates to maintain momentum through review processes.
Implement standardized feedback collection methods using Google Forms or comment systems that consolidate input from multiple reviewers. Create templates that ensure comprehensive feedback while streamlining the collection process.
Measuring Success: KPIs for Project Asset Management
Effective measurement helps teams understand the impact of their asset management improvements and identify areas for continued optimization. These metrics provide objective data for evaluating system performance.
Digital asset management dashboard showing user activity metrics, template performance, workflow breakdown, and uploads versus downloads trends
File Retrieval Time
Track the average time team members spend locating specific project assets. Establish baseline measurements before implementing organizational improvements, then monitor changes over time to quantify efficiency gains.
Use time-tracking tools or team surveys to gather data about search and retrieval experiences. Focus on frequently accessed asset types and measure improvements in average location time as organizational systems mature.
Set target benchmarks such as locating any project file within two minutes or less. Monitor progress toward these goals and adjust organizational strategies based on actual usage patterns and team feedback.
Version Control Accuracy
Measure the frequency of version conflicts, outdated file usage, and duplicated work caused by poor version management. Track incidents where team members worked on incorrect file versions and the resulting time costs.
Monitor the adoption rate of standardized naming conventions and version control procedures. Calculate the percentage of files that follow established standards and identify areas where additional training or process refinement is needed.
Evaluate the effectiveness of automated version control features by tracking the reduction in manual version management tasks and the improvement in team confidence about file currency.
Team Collaboration Efficiency
Assess the impact of integrated asset management on overall team collaboration patterns. Measure changes in email volume related to file sharing and location requests as teams adopt more efficient collaborative workflows.
Track the frequency and duration of project meetings dedicated to file organization and status discussions. Effective asset management should reduce the need for meetings focused on locating resources or clarifying file status.
Monitor team satisfaction with asset accessibility and organization through regular surveys or feedback sessions. High satisfaction scores correlate with improved productivity and reduced frustration in collaborative work.
Storage Optimization
Calculate storage efficiency improvements through duplicate file reduction, appropriate file format usage, and effective archival processes. Track storage cost savings achieved through better organization and cleanup procedures.
Measure the percentage of storage space occupied by active versus archived assets. Optimal ratios depend on project types, but most teams benefit from keeping active working files under 60% of total storage allocation.
Monitor backup and recovery effectiveness by testing file restoration procedures and measuring recovery times for critical assets. Ensure that storage optimization doesn't compromise data security or accessibility requirements.
User Satisfaction
Gather regular feedback from team members about their experience with the asset management system. Use standardized surveys that measure satisfaction with organization, accessibility, and collaboration features.
Track user adoption rates for new organizational tools and procedures. High adoption rates indicate that systems are meeting user needs, while resistance may signal the need for training or process adjustments.
Monitor support requests and help desk tickets related to asset management issues. Declining support needs over time indicate that team members are becoming proficient with established systems and procedures.
Getting Started with Kanbanchi and Google Drive
Kanbanchi's integration with Google Drive creates a unified workspace where project management and asset storage work seamlessly together. Teams gain visual project tracking, automated file organization, and streamlined collaboration without learning complex new tools.
The combination eliminates common pain points such as lost files, version conflicts, and unclear project status. Real-time updates ensure that all team members work with current information while maintaining the flexibility to accommodate different working styles and preferences.
Cost-effective pricing makes Kanbanchi accessible for teams of all sizes, from small startups to large enterprises. The solution scales naturally as teams grow, adding new members and projects without requiring significant configuration changes or additional training.
How Kanbanchi Simplifies Project Asset Management
Unlike generic project management tools, Kanbanchi is designed specifically for Google Workspace users, eliminating compatibility issues and reducing the learning curve for teams already familiar with Google's interface and workflows.
The visual kanban board approach makes project status immediately clear to all team members, reducing the need for status meetings and email updates. Asset attachments maintain their connection to Google Drive while providing project context that generic file storage cannot offer.
What Makes It Better Than Alternatives
Kanbanchi's deep Google Workspace integration surpasses basic file attachment features offered by other project management platforms. Real-time synchronization, native collaboration tools, and seamless permission management create a truly integrated experience.
The solution balances simplicity with powerful features, providing advanced capabilities without overwhelming interface complexity. Teams can start with basic kanban boards and gradually adopt more sophisticated features as their needs evolve.
How Readers Can Get Started Today
Begin by identifying your most challenging project asset management pain point, whether it's file organization, team collaboration, or version control. Start with a single project or team to test Kanbanchi's capabilities before expanding to larger implementations.
Sign up for your free Kanbanchi trial at kanbanchi.com and experience firsthand how integrated project asset management can transform your team's productivity. Within minutes, you'll be creating organized project boards that connect directly to your Google Drive assets, setting the foundation for more efficient and collaborative project work.
Take the first step toward better project asset management today. Your team's productivity and satisfaction depend on having the right tools to manage the growing complexity of modern project work. Kanbanchi provides the solution that grows with your needs while maintaining the simplicity that keeps teams focused on their most important work - Google Drive project management.
The impending shutdown of Height.app has left many teams scrambling for a suitable replacement for their project management needs. Among the myriad options available, Kanbanchi emerges as a compelling candidate, offering robust features, seamless integration with existing ecosystems, and a user-centric design that mirrors Height’s strengths while addressing its limitations. This analysis examines Kanbanchi’s viability as a replacement for Height apps, assessing its core functionalities, migration support, and value proposition for diverse teams.
The Height.app Shutdown: Context and Challenges to Find a Replacement
Height.app’s discontinuation on September 24, 2025, marks the end of an era for teams that relied on its AI-driven project management capabilities. Known for its flexibility, automation, and elegant interface, Height.app caters to product and engineering teams seeking to streamline workflows. Its shutdown necessitates a transition to platforms that preserve these benefits while offering long-term stability.
For teams, the primary challenges include:
Workflow disruption: Replicating Height’s task tracking, custom attributes, and automation.
Data migration: Preserving historical project data and ensuring continuity.
Retraining costs: Minimizing the learning curve for new tools.
Kanbanchi addresses these challenges through its integration with Google Workspace and Microsoft 365, its intuitive design, and migration support.
Core Features Comparison: Height.app vs. Kanbanchi
Task Management and Customization
Height.app’s strength lies in its customizable task attributes and AI-driven automation. Kanbanchi matches this with unlimited custom fields, advanced filtering, and automated card progress without relying on AI.
Collaboration Tools
Both platforms emphasize real-time collaboration, but Kanbanchi enhances this through native integration with Google Drive and Microsoft OneDrive. Attaching files, co-editing documents, and synchronizing deadlines with Google Calendar, as well as creating cards from Gmail and Outlook, streamline workflows without the need for third-party plugins. Height.app’s standalone chat features are replaced by Kanbanchi’s comment threads and @mentions within tasks, centralizing communication. Chat is also coming soon (summer 2025).
Project Visualization
Height.app offered Kanban, list, and calendar views. Kanbanchi expands this with Gantt charts, swimlanes, and Time tracker, providing granular insights into project timelines and resource allocation. These tools are particularly valuable for cross-functional teams managing complex deliverables.
Migration and Integration: Ensuring a Smooth Transition
Data Import and Export
Kanbanchi supports CSV and JSON imports, allowing teams to map Height.app’s task fields directly into its system. For large organizations, dedicated migration assistance is provided.
Ecosystem Compatibility
Height.app operates as a standalone tool, whereas Kanbanchi is embedded natively into Google Workspace or Microsoft 365. This eliminates redundant logins and enables:
Google Drive/OneDrive file attachments
Gmail/Outlook email-to-task conversion
Real-time document collaboration via Google Docs/Word Online
For mixed-ecosystem teams, Kanbanchi’s cross-platform support ensures consistency, whether using Google Meet or Microsoft Teams for communication.
Height.app’s pricing model, while competitive, lacked flexibility for growing teams. Kanbanchi’s tiered plans start at $3.97/user/month, offering unlimited projects and advanced features at a lower cost. Enterprise teams benefit from volume discounts and customizable permissions, making it a scalable solution for both startups and large organizations.
Limitations and Considerations: AI-Driven Automation
Height.app’s AI features, such as backlog pruning and spec updates, lack direct equivalents in Kanbanchi. Teams reliant on autonomous task management may need supplementary tools. However, most of the AI-powered features from Height.app have their equivalents in Kanbanchi without the need for AI.
Learning Curve
Kanbanchi’s extensive views (Gantt, swimlanes) require initial training, though its Google-like interface shortens onboarding compared to Asana or Monday.com, for example.
Kanbanchi as the Optimal Height App Replacement
Kanbanchi’s blend of affordability, ecosystem integration, and customizable workflows positions it as the premier alternative to Height.app. By preserving Height’s core strengths (flexible task management, collaboration, and automation) while adding robust visualization and scalability, Kanbanchi ensures continuity for displaced teams.
For organizations prioritizing seamless migration, cost efficiency, and long-term adaptability, transitioning to Kanbanchi before Height’s September 2025 shutdown is a strategic imperative. Kanbanchi's proven track record since 2013, combined with its commitment to user-centric updates, further mitigates the risks associated with adopting new tools.
By addressing Height.app’s discontinuation head-on and leveraging Kanbanchi’s strengths, teams can turn a disruptive event into an opportunity for workflow optimization. The platform’s alignment with modern project management demands ensures it isn’t just a replacement but an upgrade in the post-Height landscape. But don't just believe the words - try it for yourself!
You're not alone if you’re searching for a Microsoft Kanban board to streamline your team’s workflow and move beyond Excel for project management. Many organizations rely on Microsoft 365 for collaboration and productivity, with visual project management being a top priority. So, does Microsoft offer a Kanban board? The answer is yes, but with some important nuances and considerations.
Microsoft provides several tools that support Kanban-style task management. Here’s a breakdown of the most popular options:
Microsoft Planner
Microsoft Planner is Microsoft’s primary Kanban board tool. It allows you to:
Create boards with columns (called "buckets") to represent workflow stages
Add and assign tasks, set due dates, and attach files
Use labels, checklists, and comments for detailed task tracking
Integrate with Microsoft Teams for seamless collaboration
Planner is included with most Microsoft 365 business subscriptions and is widely used for team task management. Its intuitive drag-and-drop interface makes it easy to visualize progress and keep everyone on the same page. However, it may be too simple for many of the projects.
Microsoft Lists (Board View)
Microsoft Lists is a flexible tool for tracking information. Its Board View lets you organize list items visually, similar to a Kanban board. While not as feature-rich as Planner for task management, Lists is great for custom workflows, inventory tracking, and request management.
Microsoft Loop
Microsoft Loop is a newer collaborative workspace tool with a Kanban Board component. Loop’s flexible pages and components make it easy to embed Kanban boards alongside notes, documents, and other content, supporting dynamic team collaboration.
Microsoft Project
For advanced project management, Microsoft Project offers Kanban boards, Gantt charts, and resource management tools as part of its suite. However, the Project is more complex and is generally used for larger, enterprise-level projects.
Limitations of Microsoft’s Built-In Kanban Boards
While Microsoft’s native tools are powerful, they may not cover every need:
Feature Gaps: Planner lacks advanced features like Gantt charts, time tracking, and task dependencies.
User Experience: Some users find the interfaces less customizable than specialized Kanban solutions.
Fragmentation: Teams might use multiple tools (Planner, Lists, Loop, Teams) to cover all their needs, which can create confusion.
Why Consider Kanbanchi as Your Microsoft Kanban Board?
If your team needs more from a Kanban board than what Microsoft’s built-in tools offer, Kanbanchi is a powerful alternative. Here’s why Kanbanchi stands out for Microsoft users:
Microsoft 365 Integration
Single Sign-On: Log in with your Microsoft account for a seamless experience.
File Management: Attach and manage files from OneDrive directly within Kanbanchi.
Security: Kanbanchi boards are part of OneDrive or SharePoint.
Advanced Kanban Features
Gantt Chart View: Switch between Kanban and Gantt charts to plan and track project timelines.
Time Tracking: Monitor how much time is spent on each task for better productivity insights.
Automations: Streamline repetitive processes.
Custom Fields and Filters: Tailor boards to your workflow with advanced customization options.
Scalable for Any Team
Whether you’re a small team or a large enterprise, Kanbanchi adapts to your needs. It’s designed for organizations that want familiarity with Microsoft 365 and the power of a full-featured Kanban solution.
Kanbanchi vs. Microsoft Kanban Boards: Feature Comparison
How to Choose the Best Microsoft Kanban Board
When evaluating your options, consider:
Team Size and Complexity: For simple task tracking, Planner or Lists may suffice. For complex projects, Kanbanchi or Microsoft Project offers more.
Integration Needs: If you rely heavily on Microsoft Teams, OneDrive, and other 365 apps, look for tools that integrate smoothly.
Feature Requirements: Need Gantt charts, time tracking, or automation? Kanbanchi is a strong choice.
User Adoption: Choose a tool that your team will find intuitive and easy to use.
Does Microsoft have a Kanban board? Yes, Microsoft Planner, Lists, Loop, and Project all offer Kanban-style boards to help teams visualize and manage tasks. However, if you need advanced features, deeper integration, and a more customizable experience, Kanbanchi is the best alternative to Microsoft Kanban boards. It brings powerful project management capabilities right into your Microsoft 365 environment, helping your team stay organized, efficient, and collaborative. Try it and see for yourself.
Is there a Microsoft task management tool? Most teams attempt to coordinate projects using a combination of Excel for task lists, Word for documentation, OneDrive for file storage, Outlook for communication, and Teams for collaboration. While these tools are powerful individually, using them together for project management often leads to scattered information, duplicated efforts, and missed deadlines. There’s no single dashboard for tracking progress, assigning responsibilities, or visualizing timelines.
33. What is Microsoft Project? A modern guide with Kanbanchi
What is Microsoft Project? It is one of the world’s most popular project management applications. Used by millions of professionals, it provides powerful tools for planning, scheduling, and managing projects of any size. From simple task lists to complex, multi-phase initiatives, Microsoft Project helps organizations deliver results on time and on budget.
But as teams become more agile and collaborative, there’s a growing need for visual, flexible, and integrated project management solutions. Kanbanchi, now integrated with Microsoft 365, brings Kanban boards, Gantt charts, and real-time collaboration to your Microsoft environment. This article describes Microsoft Project and shows how Kanbanchi can enhance your team’s productivity.
What Is Microsoft Project? Core Features and Benefits
Project Planning and Scheduling
MS Project allows users to create detailed project plans, define tasks, set dependencies, and allocate resources. Gantt charts provide a visual timeline of project activities, making tracking progress and identifying bottlenecks easy.
Resource Management
With MS Project, teams can assign resources to tasks, monitor workloads, and balance capacity. This ensures that projects are delivered on time and within budget.
Reporting and Analytics
MS Project offers robust reporting tools, allowing managers to generate detailed reports on project status, resource utilization, and financial performance.
Integration with Microsoft 365
MS Project integrates with Teams, Outlook, and OneDrive, making it easy to share updates, collaborate on documents, and keep everyone on the same page.
The Need for Visual and Agile Project Management
While Microsoft Project is powerful, it can be complex and less agile for teams that prefer visual, collaborative approaches. Many organizations seek tools that offer Kanban boards, real-time collaboration, and flexible workflows, together with more professional options like the Gantt chart. That’s where Kanbanchi comes in—offering a seamless, visual, and collaborative layer on top of your existing Microsoft environment.
Kanbanchi: The Visual Add-On for Microsoft Project
Kanbanchi is a visual project management tool that integrates directly with Microsoft 365. It offers Kanban boards, Gantt charts, time tracking, and automation—all within a user-friendly interface. Users can sign up with their Microsoft accounts, access Kanbanchi from OneDrive or SharePoint file storage, and use it company-wide.
Key features include:
Kanban Boards: Visualize tasks, track progress, and manage workflows.
Gantt Charts: Plan timelines, manage dependencies, and adjust schedules.
Time Tracking: Monitor time spent on tasks and projects.
Automation: Automate repetitive processes.
Seamless Integration: Attach files from OneDrive, collaborate via Teams, and keep all data within your Microsoft environment.
Real-World Applications: Microsoft Project Enhanced by Kanbanchi
Software Development
Development teams use Kanbanchi boards to manage sprints, track bugs, and prioritize features. Gantt charts help visualize release timelines, while Teams integration keeps communication flowing.
Marketing Campaigns
Marketing teams use Kanbanchi boards to plan campaigns, assign tasks, and monitor deadlines. Files are shared via OneDrive, and updates are communicated through Teams.
HR and Onboarding
HR teams create onboarding boards, track progress for each new hire, and ensure all documentation is completed. Time tracking helps monitor onboarding efficiency.
Operations and Support
Operations teams use Kanbanchi to manage workflows, assign support tickets, and track resolution times. Custom reports provide insights into team performance.
Best Practices for Microsoft Project with Kanbanchi
Standardize Workflows: Create templates for recurring projects.
Integrate Communication: Use Teams for discussions and Kanbanchi for task management.
Leverage Automation: Automate routine workflows to save time.
Monitor Progress: Use Gantt charts and reports to track milestones and performance.
Train Your Team: Offer training to help users get the most from Microsoft and Kanbanchi tools.
Conclusion: Microsoft Project and Kanbanchi - A Winning Combination
By adding Kanbanchi to their Microsoft 365 and Project, teams unlock new levels of visualization, collaboration, and productivity. Whether you’re managing simple tasks or complex projects, the combination of Microsoft 365 and Kanbanchi empowers your team to work faster and more efficiently. To learn more about Kanbanchi, you can check out this article: What is Kanbanchi?, but we recommend starting with a free trial right now and seeing for yourself.
34. Microsoft Trello Alternatives: Find the Perfect Project Management Tool
Trello is a popular project management tool. Many use it to manage tasks and projects. However, users often look for Microsoft Trello alternatives for various reasons, such as better integration with Microsoft products or more advanced features.
Why Look for a Microsoft-Friendly Trello Alternative?
While Trello is versatile, it may not seamlessly integrate with the Microsoft ecosystem for organizations deeply invested in Microsoft products. This can lead to inefficiencies in workflow and communication. Some users may seek alternatives with features like:
Better integration with Microsoft account and OneDrive.
Enhanced security features that align with Microsoft's enterprise standards.
Features specific to Microsoft project management methodologies.
Kanbanchi: A Powerful Alternative, Now Integrated with OneDrive
Kanbanchi offers a compelling alternative for those seeking a project management tool that integrates well with Microsoft. While initially known for its deep integration with Google Workspace, Kanbanchi now extends its capabilities to OneDrive users.
Key Benefits of Kanbanchi
Seamless OneDrive Integration: Directly add files from OneDrive to Kanbanchi boards and cards.
Visual Project Management: Organize tasks visually with a user-friendly Kanban board interface.
Comprehensive Features: Utilize Gantt charts, time tracking, and user tracking within one application.
Collaboration: Facilitate effective team collaboration and client interaction.
Versatility: Adapt to both agile and traditional project planning methodologies.
Kanbanchi's integration with OneDrive allows you to inherit access permissions from your OneDrive settings, ensuring consistent security across your files.
When selecting a Trello alternative for your Microsoft environment, consider the following:
Features: Does it offer the necessary features for your project management needs, such as Gantt charts, time tracking, and reporting?
Ease of Use: Is the interface intuitive and easy to learn for your team?
Security: Does it meet your organization's security requirements?
You can find a Microsoft Trello alternative that enhances your team's productivity and streamlines your workflow by carefully evaluating these factors. Kanbanchi is an option you can try. Great news for those ready to migrate from Trello - import from Trello is available in Kanbanchi. It will make the migration process go quickly and smoothly.
O Google conta com um pacote de trabalho (Workspace) que inclui uma variedade de produtos. Gmail, Google Docs e Google Sheets são alguns dos mais conhecidos e notáveis deles. Mas muitos gestores de projetos pedem uma solução que inclua um gráfico de Gantt no Google Workspace. Infelizmente é algo que de fato faz falta no Workspace. Entretanto, uma alternativa é muito fácil de ser encontrada. Kanbanchi oferece aos usuários do Google um gráfico de Gantt com desempenho espetacular no Google Drive. De bônus, ainda é uma solução completa para gerenciamento de projetos.
O Google sugere que usuários usem planilhas para criar gráficos de Gantt. Usuários podem até mesmo consultar instruções detalhadas de como fazê-lo. Enquanto essa pode ser uma alternativa para alguns, a maior parte dos gerentes de projetos irão concordar que é bastante inconveniente e demorado criar e manter esses gráficos atualizados. Além disso, planilhas, em seu cerne, não são voltadas para gerenciamento. Elas são boas para cálculos e armazenamento de informações. Em nosso mundo atual de permanente mudança, precisamos de ferramentas mais flexíveis. Para empresas que usam o Google Workspace, é crucial terem nesse meio tempo ferramentas sincronizadas e os dados que sejam armazenados em um só lugar.
Gráfico de Gantt no Kanbanchi
O Kanbanchi oferece uma solução de gerenciamento de projetos que inclui um quadro Kanban, gráfico de Gantt, monitorador de tempo e outras ferramentas valiosas para o fluxo de trabalho diário. A ferramenta é integrada com a maior parte dos apps do Google e é hospedada no Google Drive. O gráfico de Gantt dentro do app é extremamente fácil de ser usado, criado e mantido. Modificações podem ser feitas em um ou dois cliques e estarão no quadro Kanban em um piscar de olhos. A aplicação Kanbanchi sustenta o objetivo principal do Google - transparência nos fluxos de trabalho. Isso quer dizer que todas as mudanças são completadas em tempo real e todos os colegas de trabalho são imediatamente atualizados.
Kanbanchi é um software de gestão de projetos online com Kanban Board, Gantt Chart e Time Tracker. Kanbanchi não precisa de ser instalado, porque pode ser acedido através do seu navegador. É também muito utilizado para trabalhar em equipa e gerir tarefas, visto que fornece uma plataforma em que todos os membros da equipa podem aceder ao mesmo tempo. O Kanbanchi complementa os aplicativos do Google Workspace e está integrado à infraestrutura do Google.
O Kanbanchi foi criado especificamente para o Google Workspace. Inscreva-se com uma conta Google e a partir daí pode alterar os seus quadros de projeto como arquivos no Google Drive, conceder permissões de acesso flexíveis,criar eventos no seu Google Agenda, anexar documentos, planilhas e formulários do Google aos seus quadros e muito mais.
Gerir tarefas no quadro Kanban
O quadro Kanban é uma ferramenta poderosa amplamente utilizada para gerir projetos. É extremamente popular entre as equipas que usam metodologias ágeis e scrum no seu fluxo de trabalho. Os cartões agrupados em listas e colocados num quadro podem fornecer uma imagem clara do seu projeto. A capacidade de compartilhar quadros com os seus colegas no Google Drive corporativo oferece uma maneira fácil e rápida de colaborar. Basta configurar um quadro para o seu projeto, compartilhá-lo e colaborar em tarefas em tempo real.
Planeie projetos no Gráfico de Gantt
Todos os quadros Kanban no Kanbanchi podem ser convertidos num gráfico de Gantt com um clique. Com este gráfico, poderá ver as relações de tarefas no tempo e entenderá a cronologia de seus projetos. Ajustar os horários é muito fácil no gráfico de Gantt. Basta arrastar a borda da barra.Todas as alterações feitas no gráfico de Gantt serão refletidas no quadro Kanban.
Verifique o desempenho da sua equipa com relatórios
O Kanbanchi possui uma coleção de relatórios integrados que podem ser criados com base nos seus dados. A coleção inclui os gráficos mais populares, como gráfico burn-up/burn-down, diagrama de fluxo cumulativo, gráfico de desempenho e muito mais. Ele ajuda a monitorar o progresso da sua equipa e a fazer alterações nos seus processos de trabalho, se necessário. A análise é a chave para a produtividade, por isso é crucial verificar o seu progresso regularmente.
Recursos prontos para empresas
As empresas que usam o G Suite corporativo têm um grande benefício de uma instalação de domínio do Kanbanchi. Ele fornece uma adoção suave do aplicativo em toda a organização. Todos os usuários do domínio terão acesso ao aplicativo e, portanto, poderão começar a colaborar sempre que precisarem. Sendo construído no Google Cloud Platform, o Kanbanchi oferece o mais alto nível de segurança. Ele atende a rigorosos padrões de privacidade e conformidade que garantem a segurança dos seus dados.
Se quiser saber mais sobre o Kanbanchi como um aplicativo corporativo, faça o download da apresentação (língua Inglesa) – ou comece um teste gratuito agora mesmo.
37. ClickUp Alternatives: Kanbanchi for Google Workspace
Why do people search for ClickUp alternatives? One of the reasons may be that you need an easy-to-use and easy-to-set-up application that even not so tech-savvy team members can successfully use.
Kanbanchi is extremely easy and fast to start working with. You start getting value out of the app the first day you and your team sign up. Intuitive and familiar Google apps interface will help to save time on learning. Kanbanchi is developed specifically for Google Workspace users, that's why people typically spend 15 minutes in the app and start actually working with it.
How do I master Kanbanchi in 15 minutes?
So you are into the idea of getting value out of the app without spending much time learning it? Then, Kanbanchi is exactly what you need!
Watch this short video introduction to Kanban boards first (1 minute)
Create a board for your team, add the tasks you are currently working on, and share it with collaborators (5-10 minutes). Watch our video tutorials for more detailed guidance.
Kanbanchi is the only of ClickUp alternatives that integrate into your Google Drive, all the information will be stored there. All you need to log in is your Google account, no other logins, and passwords. If you feel the need for a project management app inside your Google Workspace, then Kanbanchi is your best choice.
Store your important files and documents in your company's Google Drive, and have them attached to project boards in Kanbanchi at the same time. This is an extremely secure way of providing quick access to the information related to your team projects without uploading it to another application.
Other benefits of seamless Google Workspace integration include:
Attaching files from your Drive/Shared Drives to Kanbanchi boards in just a second;
Adding tasks to your Google calendar and any Google calendar that you have access to;
Having similar familiar and intuitive interface;
Converting emails to tasks from within your Gmail (including mobile Gmail);
Creating tasks from Google Forms;
Inheriting access permissions from your Drive settings the same way it works for all other files in your Google Drive;
Exporting boards data to Google Spreadsheets. Later you may use them for various purposes;
Creating custom reports out of exported Spreadsheets using Google Data Studio.
Learn more about Kanbanchi as a project management tool inside Google Workspace
What if I'm not sure that Kanbanchi is the best project management software for me?
We'll be honest, there's no ideal software. But you need to compare how this app or another can help you achieve your goals. Define your goal first. What you would like to achieve with project management software? Then try to set up a board according to the goals of your project.
Think about the tasks that you need to do to achieve your goals, about the stages that those tasks will go through. In a very simplified model of a kanban board, these stages are 'To do' - tasks that you need to do to reach your goal, 'Doing' - tasks that you are currently performing, and 'Done' - what you've already accomplished. Your board will look like this.
Start with a free Kanbanchi trial, our team will be with you along the way, we will help you with your boards during the onboarding process. Just get on board. Kanbanchi board
The popularity of the Workspace suite of tools from Google has led to many teams using it to boost their productivity. Yet one of the key questions often asked is how they can use a Google Workspace Gantt chart to further boost their efficiency.
A Gantt chart is a visual representation of a plan and the individual tasks that make it up. This sort of chart is used to plan the resources and schedule tasks to ensure that everything runs as smoothly as possible. The clear, simple design makes it easy to use and also to understand at a glance.
Gantt charts are present around the planet for planning purposes. They can be hugely beneficial in helping to avoid issues such as missed tasks or two people carrying out the same task. One area where it’s particularly good is in helping you to link related tasks. So, their dependency is clear from the start.
Is There a Gantt Chart Provided by Google?
While this method of project planning is extremely popular, Google hasn’t added one to its online productivity suite. This makes it difficult for teams who want all of the benefits of Workspace but need to carry on with the Gantt approach to manage their tasks in the way they’re used to.
The idea of going outside the Workspace to plan and track projects isn’t appealing. This means losing some of the benefits of using it in the first place.
Thankfully, the Kanbanchi tool provides an ideal solution, as it’s seamlessly integrated with Workspace. This makes it the best option when your team is looking for a Google Workspace Gantt chart. It meets their needs and allows them to work together more productively.
No, it isn't. Certainly, these two concepts should be divided. Let's figure out what the difference between a task board and a kanban board is. Who will win in the 'Task board vs Kanban' battle?
To understand Kanban system better, you may check out this article: What is Kanban System?
What is a task board?
A task board is a tool that represents work and the path towards its completion. The work at hand can be displayed in just a few columns or distributed on several organizational levels. No matter how easy or complex a task board is it is still an important tool for successful task completion. First of all, it helps to distribute and prioritize items. Additionally, it serves for better team collaboration. As a result, a team is able to be productive and deliver a high-quality product. These factors make a task board an essential part of any workflow where people are working together.
How a task board can help a team?
If a task board is organized correctly it is definitely of service. It helps teams
Visualize workflow
Have all information in one place
Distribute tasks
Improve productivity
Meet deadlines
Set dependencies
Everybody in a team can consider a task board as a centralized resource for all the tasks. Thus, you may review tasks and discuss project changes, overview progress and set goals.
If you wonder who can use a task board, the answer will be simple - everyone. It is safe to say, task boards bring value to any workflow no matter if it is software development, manufacturing or business development.
What is a kanban board?
Now when you know more about task boards we will cover the concept of a kanban board.
Just like a task board, kanban consists of cards and columns. The most frequent structure of a kanban board is To-Doing-Done. It means that you see the queue of tasks, the items already in work and the completed ones. The number of items you may have in columns is limited. The work in progress limit is especially strict. The kanban method correlates with the concepts of constant improvement and optimization.
How a kanban board can help a team?
First of all, the aim of a kanban board is in time delivery. The team members direct their efforts to keep up with deadlines. Also, it serves to limit the in-progress amount of work. Thereby, it ensures that the team commits the right amount of tasks in certain timeframes. Usually, tasks on kanban boards are small enough to avoid busywork. So it is easy to handle tasks.
Task board vs Kanban?
Generally speaking, a task board is a more broad term than kanban. While a kanban board can be considered as a type of task board. Both are methods of task representation, but kanban has more defined rules. We can observe cards and columns on both boards. You just need to decide what columns your workflow needs. Additionally, if you feel that the kanban methodology can bring value, it will be a good decision to try it.
There is a tool that allows building a task board and a kanban board - Kanbanchi. There will be no need to decide what specific approach you need to adopt. In Kanbanchi you may build various types of boards for different projects. What's more, the data from one board can be viewed from different angles. Thus, you may quickly switch to the Gantt chart to see the tasks in a timeline or click Task view to see the items in a simple list. The list grouping feature serves to group items in columns depending on what kind of data they contain, e.g. priority or assignee.
The Kanban board is an incredibly helpful tool for teams using Agile. In today’s digital age, countless companies are finding that they need to become more efficient, competitive, and agile in order to keep up with competitors. For such organizations, the Kanban methodology for process improvement is proving to be the ideal strategy to improve their business processes. So let's take a look at what Kanban means for Agile and what is Agile and Kanban itself.
What Is Agile And Kanban?
Agile methodologies are based on changing priorities and delivering new features with short interval timeframes. This means having teams capable to deliver small parts of the project rapidly, using scrum methodology. Successful Agile teams do not generally consider themselves to use a single methodology. Instead, team members prefer working with a certain set of Agile tools once their projects become more mature.
Kanban is a very essential and powerful Agile project management tool. It comes from the Japanese word Kanban and has two meanings: Visual Card and Sign-board. The significance of these two words is that they highlight the importance of using visual tools instead of text-based info to plan, manage and track a project's progress.
What Does Kanban Board Mean For Agile?
If you are an Agile user, then it stands to reason that you know exactly what Kanban is – it’s a methodology that allows you to remove waste through the use of visual boards and cards. In Agile, the Kanban board is a visual representation of the workflow of how the team approaches their work. It shows what tasks are involved and how they progress by giving you the ability to see everything at a glance. The Kanban methodology was created with this in mind, as it breaks down each step of your process for managing any project.
When you’re thinking about starting to use Agile, you often hear that Kanban is the recommended approach. Mostly because it is more of a flexible methodology. If you want to know about Kanban and Agile project management, let’s agree that you should start with a visual approach. A Kanban board isn’t always necessary. But it can be the most useful tool for any Agile project because it can help to keep one thing in mind at all times - the concept of staying flexible.
Kanban board is a very essential and powerful Agile project management tool. And Kanbanchi is a leading project management tool that offers Kanban boards to its users. It helps you to gain control over your workload and optimize the workflow with your team. In addition, it perfectly integrates with Google Workspace. Kanbanchi can help your team to work and collaborate more efficiently. Sign up today and get a 14-day free trial.
41. What Is The Difference Between Kanban And Scrum Board?
The Kanban board and Scrum board are two of the popular project management tools you can use to manage your business or even a team. Many companies use the boards at different stages of their development. Each method has its own strengths and weaknesses, but the two complement each other nicely.
Though they might sound the same, Kanban and Scrum project management systems are completely different. However, both of them will offer you a great way to keep track of how your projects are going and help you in improving your workflow. The key question is to understand the goal that you want to accomplish and then decide which tool suits you best.
What Are Kanban And Scrum Boards?
Scrum boards and Kanban boards are both tools for visualizing work in an agile setting. They are used to track the progress of a team's work overtime like scrum master sprint planning, running sprints, and release planning. Both tools are used for managing product backlogs. But a team can choose one over the other depending on their preference.
These boards are an essential part of agile software development. They help teams visualize work, track progress, and make use of step-by-step information. Two management techniques have grown in popularity over the past few years, and they both can be used to increase efficiency. Scrum is a popular method of project management that’s based on the Agile methodology created by software developers. Kanban, another prevailing practice for product development, is a way of using simple visuals (or cards) to get work done. Both Scrum and Kanban allow for increased productivity and updated planning. However, there are key differences between the two.
The Difference Between Kanban And Scrum Board
Having a Kanban board or a Scrum board can be useful for teams working on projects. A Kanban board is used to visualize and show the status of work in progress. While a scrum board does the same, it does have some distinct differences from a kanban board. The difference between the two lies in how information is presented. You see, Kanban boards focus on completing tasks sequentially whereas scrum boards focus on delivering things where they're needed most.
Anyone who has ever participated in an Agile project knows that a backlog of tasks is used to navigate the project’s progress. It is a list or chart of all the work that needs to be done in the future. In my experience, I have seen scrum used almost exclusively within startups and smaller companies. This is because in a startup environment the team often adjusts as new staff comes and goes, as opposed to larger companies where team members are more established. So they can be more flexible with their current processes.
On the other hand, I have seen Kanban being used within larger organizations especially when it comes to IT projects. Since most IT projects require long lead times and tend to be relatively fixed for a longer period of time. Kanban works well for keeping these types of projects on track. In addition, the fact that Kanban requires less change control than scrum means that it works well with large teams that may already have an established approach already in place.
Kanbanchi project management app lets you create visual boards and move tasks using Kanban methodologies. Try it today and visualize work, manage your projects and easily track your team's progress!
The same-named app is designed specifically for Google Workspace users. It provides them with a project management solution within a familiar environment.
If we look at the search level for “Google Workspace project management”, we’ll understand that there’s a great demand for an app integrated with Google’s pack.
What people are looking for when searching for Google Workspace project management?
The main point of the search is to find an app that’s easy to use and that operates the same way Google Workspace does. Kanbanchi works in Google Drive and acts exactly like any other file that you put inside your Drive. You can create boards for your projects and then open and share them from your Drive as well as from within the app. It helps to master the app in less than 15 minutes.
The most common request from project managers working in companies that use Google Workspace is to have an app that supports a kanban board, Gantt chart, or resource board. At the same time, they need to attach files from Google Drive and synchronize their apps with Google Calendar.
Then, Kanbanchi is a perfect fit for you! It has all these features in one with real-time synchronization. It makes collaboration extremely smooth and transparent so that Kanbanchi will soon become the tool for everyday usage for your entire team.
43. What Is an Enterprise Dashboard and What Are Its Benefits?
Can you imagine what your life would be like with an organized system that speeds up your efficiency, cuts down on unnecessary work, and increases the work getting done? As a business owner, you have to keep many things in mind: ongoing projects, tasks, appointments, and many more. All this information has been made possible in today’s day thanks to countless online services that aim at keeping your business organized and productive. And today I would like to tell you more about Enterprise Dashboard.
The internet is no doubt one of the greatest tools in the world today. It has helped many businesses reach new heights and improve their way of doing things. However, with all its benefits, there are also many distractions that might lead to you getting overwhelmed. That is why you need an enterprise dashboard tool to stay organized.
Enterprise Dashboard is an online system that will help you to stay organized and on top of the game. This means that you can make better use of your time. Businesses that have team members need enterprise dashboard software that provides valuable data to management. Moreover, the enterprise dashboard provides you with the type of information you need to develop your workforce and increase profits. Getting better at tracking projects and tasks helps a business grow by providing key information to its stakeholders.
Enterprise Dashboard can help your business to reduce the time that it takes to complete projects. In addition, provides a visual way of tracking your workload and work. It helps to communicate with colleagues and business partners efficiently, but also monitor and control various situations and trends using all of the information we have at hand. And collaboration is the key in business.
Benefits Of Using Kanbanchi Enterprise Dashboard
Kanbanchi’s Enterprise Dashboard lets users visualize the progress of their projects and tasks. This visual representation is what sets this tool apart from other project management tools on the market. Kanbanchi helps you ensure that your business runs efficiently by providing a full overview of all its ongoing projects while making it easy for you to make changes. With Kanbanchi you will be able to easily organize all of your tasks, from the small daily tasks to the more far-reaching ones. In other words, you can better manage them, make them more visible to your team members, and ultimately get more done faster. You can start for free today!
44. What is the difference between Kanban and Task board?
Difference between Kanban and Task board? Sure, that's an interesting question. Let's first find out what these terms mean. It won't be difficult to find the difference after that.
What is a Task Board?
The Task Board is a type of visual management tool for project planning and keeping track of the work. Tasks are usually represented by ‘cards’. Such cards can be arranged within something as simple as a few columns drawn on a board or dispersed among multiple levels of organization. As Task boards are very flexible, they are applied universally by individuals, teams, or organizations to represent their work and path towards completion.
Well organized task board allows people to collaborate, prioritize and deliver a higher quality end-product on a more regular basis. Such Task boards contain all of the information about each task at every stage of the workflow. That's why teams are able to stay on the same page and work smarter.
And what is a Kanban Board then?
A Kanban Board is a visual way to manage workflow as well. Basic Kanban Boards usually have three columns. Let's name them: to do, in progress, and done. Here we also can find cards representing tasks. Any task that is not yet started stays in the to-do column. Once a task has been started, it goes to the progress column. Finally, when a task is completed, it goes to the done column.
As you can see the whole idea of the Kanban Board is very simple and useful at the same time. This powerful combination makes the method so popular. Kanban Boards were originated in manufacturing as a way to improve efficiency but now they are used across all areas of business to manage projects. A Kanban Board works by limiting the number of tasks that are in progress at a time. You can achieve this by using three key components – a visual task board, work-in-progress limits, and inspections. Thus a Kanban Board shows what work is ahead, what has already been done, and what is in progress.
And what do we get out of this?
So now we can easily understand that Kanban is just a type of Task Board. Scrum for example is one more popular type of Task Board. Therefore, the question of the difference between Task board and Kanban is simply incorrect. Any Kanban board is also a Task board at the same time. But not every Task board is designed according to the Kanban method.
Currently, there are quite a lot of online Task management tools designed to simplify the work with tasks and increase productivity. We would like to draw your attention to Kanbanchi. This Google-integrated application was originally designed to work with Kanban boards, and it fits the bill perfectly. However, the application continues to evolve and become more flexible and versatile. Therefore, you can easily use it and follow the Scrum methodology or create a Task board based on it according to your own rules.
Whether you’re managing a team or running your own business, it’s important to keep your team organized. Scrum and Kanban are two popular project management methodologies that might help you in maintaining the workflow. So let's find out what is the difference between Scrum and Kanban?
Kanban and Scrum are used to track and visualize work in an agile setting. They visually display the list of tasks and how far they have been completed. When you are working with a team of 4+ people, one of these tools should be used to know exactly what is going on with their work, the progress they have made, and more.
The purpose of a project management board is to provide an overview of the current state of projects in all phases and to create awareness of open tasks that may hold up or delay further projects or problems. There are many workspaces that people use to manage their software development, infrastructure, and business processes. A good project board should have limited information overload while still informing you about what’s going on.
The Difference Between Scrum And Kanban
Scrum and Kanban are both project management methodologies that are designed to improve project delivery times. While these approaches are different, each method has its strengths and weaknesses, as well as its own advantages and disadvantages. Scrum and Kanban not only visually show where your tasks are at, but also allow other individuals to see what needs to be done. Both are great ways to manage your work, but each of them has different methods and reasons.
Scrum boards can work for the types of projects that you do, but kanban allows for more flexibility and adaptations to your actual workflow. Two different methods for managing projects. Scrum and Kanban both seek to improve project delivery, but the way they do it is entirely different. What works for you will depend on your particular working environment, as well as the people involved in the process.
Are you looking for a tool to help you with team communication and collaboration? Kanbanchi is a task management tool for teams of all sizes. Stay agile, stay on top of your tasks and improve communication with Kanbanchi.
46. What is a Google Workspace Collaboration App for Productivity?
As far as collaboration tools for productivity go, Google Workspace is the leader. They have a little bit of everything in their productivity package for online collaboration, including:
Gmail - business emails
real-time chat
shared calendars
Google Meet - video conferencing
Docs, where up to 10 people can work simultaneously
Impressive Google Workspace Collaboration App for Productivity
Google Workspace is a powerful suite for communication and document work: Gmail, Drive, Calendar, Docs, Sheets. But it has a gap: there's no built-in app for managing projects and tasks visually. Teams can edit a document together, yet they can't see who owns what, what's in progress, what's blocked, or what's overdue. That's the missing piece a Google Workspace collaboration app fills.
Kanbanchi is built specifically for this. It's a project management and task management app that lives inside Google Workspace rather than alongside it. Your boards behave like any other file in Google Drive. Open them, share them, and set permissions exactly as you would a Doc or Sheet.
What it adds to Workspace:
Kanban boards to visualize tasks moving through stages, from To Do to Done
Gantt charts to schedule work, set dependencies, and track milestones
Time tracking to measure estimates against actual time spent
Real-time collaboration so the whole team sees changes as they happen, and who's working on what
Because it's native to the ecosystem, the things your team already relies on keep working. Attach files straight from Google Drive, sync card dates with Google Calendar, and create cards directly from Gmail. There's no separate login and no exporting work between disconnected tools. The project board sits in the same environment as everything else.
For non-technical teammates, the visual board model is easy to pick up, so adoption doesn't need lengthy training. For managers, the same boards support workload views, filtering, and exports for reporting. And for organizations on corporate Workspace, Kanbanchi can be installed domain-wide through the Google Workspace admin panel, giving everyone access at once.
The result is a more complete way of working: keep using Google Workspace for documents, email, and meetings, and add the project and task layer it was always missing.
Looking for enterprise and admin features like domain installation and Vault discoverability? Check the list of integrations
47. How to increase productivity using a Kanban board online?
The Kanban methodology has helped revolutionize the way we work. While it was created in Japan back in the mid-20th century, it is still used in modern teams as a way of visualizing work online. This approach uses Kanban boards, which began as a manual system involving paper cards getting moved across a physical board.
However, the system has proved to be ideal for use in modern teams working remotely or in a hybrid manner. A board is divided into columns covering the stages a task needs to go through, such as to-do, in progress, and completed.
By adding this timeless way of managing tasks to modern, sophisticated online environments, we can increase productivity and efficiency. The emergence of online Kanban boards lets us see at a glance how our tasks are progressing and whether there are any bottlenecks to be removed.
Physical boards simply can’t match the way that online versions provide a centralized, reliable source of data that is updated in real-time. We can now share the current situation instantly with colleagues and stakeholders, no matter where in the world they’re located.
A physical board has some disadvantages compared to the Kanban board online: stickers fall down, you have to rewrite them...
Physical vs. Digital: Why Move Your Kanban Board Online?
Project transparency used to involve sticking colorful notes onto a whiteboard, meaning that they needed to be moved manually every time a task was carried out. This worked well for many years, but digital boards are now available to give us a more efficient way of tracking tasks without the limitations of physical boards.
Moving to an online Kanban board isn’t just about using the latest technology to make your office look neater. It’s also a way to introduce a fundamental shift in the way that you handle your tasks and collaborate with colleagues.
We can see the major benefits of making this switch by looking at each of the areas where a digital Kanban board makes a big difference. The following are some of the most important points.
Real-Time Accessibility and 24/7 Collaboration
With remote working now crucial to many companies, it’s clear that being able to access their to-do lists and update them conveniently is a major factor. The old-fashioned approach of a physical whiteboard simply wouldn’t work in the modern office setting.
This is why the virtual boards that are constantly synchronized provide an invaluable way of keeping everyone up to date with the latest developments. Each team member can log in at any time and from any location.
This approach means that everyone knows exactly where each task is at and who is dealing with it, with automatic notifications removing the risk of a communication failure. It also allows real-time collaboration where two or more remote colleagues can update the progress at the same time.
Better Security and Version Control
One of the major problems with those physical Kanban boards of the past was the risk of someone accidentally updating them with the wrong details, or even causing the whole thing to be lost or ruined.
The comprehensive security that is now available for digital versions means that this is no longer an issue. With access permissions and automated backups, there is now no reason to worry about the data being lost or corrupted.
More Details and More Convenience
Moving a small physical card across the wall is a simple yet highly effective method of tracking progress. Yet, it had another drawback that has now been resolved thanks to the online version. This is the way that those small cards could only fit a limited amount of information on them before becoming messy and confusing.
The arrival of online Kanban software means that we can now add all of the relevant details easily. By linking project documentation to the task, it also becomes easier to track everything conveniently and without any confusion. Even the most complex task becomes easier to handle.
Online Kanban Board At Work
Kanban is highly recommended for small business owners and entrepreneurs. It is easier to assess your progress when you are working in a large organisation alongside many team members. It’s quite a challenge to keep yourself motivated when you are on your own.
When you have a small team to lead, there is always a need to boost morale and let people know why their work is equally important. Although an online Kanban board can never substitute for verbal communication, it can help you in this area.
Team members get excited and work more efficiently when they see cards moving up the board. They feel important when they see how their small tasks fit into the bigger picture. Another great aspect of using a Kanban board is that you get foresight. It’s easier to remember every task.
For large business owners and managers, online Kanban boards offer a great deal more. It’s possible that you are working on multiple projects and different teams. It gets very difficult to keep informed about every task. However, it’s important to stay well-informed so that you know the project is moving in the right direction.
With Kanban boards, you can achieve higher productivity without any stress. Kanban is a pull system. A worker can pull as much work as he can complete rather than having work pushed towards him. Kanban is a great way of increasing team collaboration. Each day, you can gather around a table and discuss the project, new ideas, and progress. Every team member will know where the project stands because they can see it on the online Kanban dashboard.
An added advantage of online Kanban boards is that you can calculate necessary statistics during and after project completion. These statistics can help you overcome potential problems and bottlenecks.
Kanban Board (online) At Home
Family like a team has its collective goals and each family member needs to display good teamwork. When you stick together and help each other out, you live a happier life. How about letting an online Kanban board improve your personal life?
For those of us who have to manage work, family and social life, having an online Kanban board is bliss. We need to focus on many tasks simultaneously to have a successful and balanced life. It’s a talent to manage all three. It’s all about managing priorities and paying attention to the right task at the right time.
A Kanban board makes the entire workload visible. And when used at home, it keeps you and your family motivated and improves your communication.
Another major advantage of using a Kanban board in your personal life is that you can keep track of your expenses. When you see all your work on the board, it gets easier to work out the time and money it will require.
The Kanban board is equally great for students, especially at the college level. With so many assignments, projects, tests and competitions going on, you practically have no time to attend all the parties and gatherings. Kanban can help you there.
After finishing one task, move it along the virtual board and start on the next step. You will feel motivated to work on the tasks as you see their progress along with the board.
The online Kanban board - Kanbanchi can be used at work, at home or at class. Check out the benefits of this app for any of the three aspects of life.
How to Use Kanban to Increase Productivity in 2026
The way we work has changed massively in recent years, so it’s easy to see why old-fashioned productivity solutions no longer work like they used to. This means that we need new solutions that help us to increase productivity in this new setting.
By using the Kanban methodology correctly with the latest technology, you can continue to make the most of this clever approach while also benefiting from current software. Take a look at how the core principles of Kanban are used effectively in this online approach.
Visualizing the Workflow
Making the work visible to everyone is the first important point that we need to consider when boosting productivity. This is a particularly important point with remote teams, as tasks are often buried in email threads or chats.
By using a digital Kanban board, all of the tasks are clearly shown as individual cards. In addition, all of the different stages that the task needs to go through are shown as columns. This makes the whole process transparent and easy for team members to follow.
Visualizing the workflow in this way lets you identify bottlenecks just by looking at the screen. If a project is stalled or running behind, you can see exactly why this is happening, which is the first step to solving the issues.
It also creates a culture of ownership, since each card is assigned to someone who is expected to take it through the different stages. There is no doubt over who is responsible for every task ¡, or when it needs to be done by.
Limiting Work-in-Progress
Constantly switching between different tasks and leaving some jobs unfinished is one of the biggest concerns in the modern business world. This can lead to tasks being left unfinished until they’ve turned urgent, or getting confused with other tasks.
Adopting a Kanban approach means that there is a limit on the number of tasks that can be in the “doing” stage at any time. Using Kanban to increase productivity forces team members to concentrate on the tasks in front of them, rather than having a large number of alternatives that they can jump between.
Changing to this mindset helps to reduce the time wasted on unfinished tasks that don´t provide value. The team´s energy is directed into the areas where they can make a positive impact by completing something.
This also feeds into a healthy way of working where managers don’t overload their team members. Instead, they’re given the right amount of work, taking into account the outstanding tasks that everyone can see. Team leaders can see at a glance how much more work someone can handle without being under excessive pressure.
Managing and Optimizing Flow
Managing the workflow wisely has become one of the major challenges in every company. While the emphasis was once placed on managing the people in the team, it has now moved to making sure that the work flows through the different stages.
This involves monitoring the lead time, which tells us how long it takes for a task to move through from the request stage to delivery. On the other hand, the cycle time tells us how long is spent actively working on the task.
These metrics can be seen easily in Kanban software. This means that it can be used to analyze the time taken for each task and work out how to include continuous improvement measures.
Features of The Best Online Kanban Board for Google Workspace?
Changing to the best Kanban board online is a smart move, but how can you make sure that it fits your current way of working? With many teams now carrying out most of their daily tasks in the Google Workspace ecosystem, choosing native Google integration for task tracking is worth considering.
Workspace is typically used for email (Gmail), documents (Docs), and meetings (Meet). Sheets and Slides are among the other useful apps that can help teams organize their work, with Drive storing everything securely in the cloud.
The Power of Native-Level Integration
By using a Kanban board with native integration, you get the seamless experience of everything feeling that it’s in the right place. You don’t need to worry about having to learn new tools or jumping across different tabs to find what you’re looking for.
Google users who are familiar with the look and feel of apps like Gmail and Drive can adapt effortlessly to the new way of working while using tools that they’ve already learned to use. In this way, managing tasks using the Kanban technique is as easy as sending emails and storing documents in Drive.
Shared Drive Integration
This is a key feature, since it allows all team members to safely store and access their documents. It’s a crucial step because it means that the company’s existing securities and permissions are seamlessly transferred across to their project work.
This feature also means that attaching files to a task is a simple process. It allows team members to find the documents they need directly from a task on the Kanban board, adding an even greater level of efficiency.
Integrated Gantt Charts
The task-based approach of a Kanban board is ideal for day-to-day use. Yet, there are also times when being able to see the bigger picture is essential.
This is where having Gantt chart functionality on your software is a huge boost. It lets you see all your milestones and how they relate to one another. Adjusting a date on your Gann chart should automatically lead to the Kanban card updating, meaning that you always have the latest information on the screen.
Native Time Tracking
The all-important native feel is also found in the time tracking element. This is where team members can enter a card and start tracking time right away. By doing this, you get detailed reports that can be easily exported to Google Sheets when needed.
Without third-party time-tracking apps, the performance data is kept within the Google ecosystem. It helps simplify the working process by ensuring that nothing slips through the cracks and gets lost.
Meet Kanbanchi - The Top-Rated Online Kanban Board for Teams
The task of managing projects using Google Workspace becomes a lot easier when you have a tool that brings together all of the different apps smoothly. This is where Kanbanchi comes in, by giving you a professional, centralized hub from where you can control your tasks and data.
Kanbanchi interface showcasing Kanban board
Since it’s integrated with Workspace at a native level, it acts as the perfect bridge between your daily tasks and the tools that you need to access to carry them out.
Convert Emails to Actionable Cards
Your Gmail account is where a lot of your tasks and projects begin. Yet, this means that there’s a risk of losing the details on long threads. The good news is that you can transform any email into an actionable card with just a single click.
In this way, Kanbanchi turns your inbox into a more valuable tool that lets you jump straight to a Kanban card. The email subject is used as the title of the card, with the body of the message becoming the description.
Real-Time Collaboration and Syncing
The real-time collaboration on Kanbanchi is similar to the way that you and your colleagues can edit a Google Doc or Sheet at the same time. It means that the information on your Kanban boards online on the screen is always up-to-date and ready for you to use.
As soon as someone updates a card or moves it to a different column, everyone else can see what has been done. Since the boards are stored as Google Drive files, you can easily control the access permissions based on your existing Google groups.
Visual Priority Sorting
Having a cluttered board is one of the biggest obstacles to good productivity levels. If all of your tasks look the same, team members may struggle to understand which are the most urgent items. This can lead to the workflow process stalling or being delayed.
By adding robust visual priority sorting tools, you can make sure that the team can cut through the noise and fully understand what needs to be done first. A combination of custom tags, color-coding, and the right positioning means that each list is easy to prioritize.
Step-by-Step: Setting Up Your Online Kanban Board in Minutes
It only takes a few minutes to get up and running with Kanbanchu, giving you the benefits of a professional Kanban board right away. You just need to follow these steps to get started without any delay.
Step 1: Install from Marketplace
The first thing you need to do when using Kanban to increase productivity is install Kanbanchi from the Google Workspace Marketplace. Head to the Marketplace, then search for Kanbanchi.
When you click “install”, you’ll be asked to grant the necessary permissions. This approach means that you now have Kanbanchi natively integrated on your Google app launcher, so you easily access it along with the likes of Drive and Gmail.
Step 2: Connect Google Account
The next step is to launch Kanbanchi and sign in using your existing Google password credentials. This allows you to start using it without the inconvenience of having to set up new password details and create a new profile.
At this point, Kanbanchi will be able to sync automatically the contents of your Google Contacts. It’s an important step, because it gives you a way to start assigning tasks to team members without having to import any contact details.
Step 3: Create Boards from Emails
You’ll now be able to use the powerful Kanbanchi features, such as being able to turn Gmail threads directly into Kanban cards.
This is done using the Kanbanchi Gmail Add-on. Whether it’s an internal briefing message or a formal client request, you can simply create a new task without having to leave your inbox. This removes the risk of vital information being lost in an email thread.
Step 4: Use Gantt and Kanban Views
Using Kanban cards gives you a smart way of looking after your tasks. This is ideal in the following situations.
Daily meeting updates.
Tracking the current flow of the to-do list.
In other situations, you might find that Gantt charts are ideal for the following.
Longer-term planning.
To map out dependencies.
Set project milestones.
See how any task delays would impact the overall project timeline.
You can just toggle between these views as you want to change them according to your current needs.
This is a visual project management tool that is used to let teams see their workflow details. It is considered to be a tool that increases efficiency, which is done by dividing tasks into columns that show what stage they are each at.
What are the benefits?
A Kanban board online transforms unclear or abstract to-do lists into a clear, visual approach where it’s easy to see the status of the project and its different tasks.
Can I integrate with other tools?
Digital Kanban boards can be integrated with other online tools to make them even more effective. In the case of Kanbanchi, the native integration with Google Workspace that it offers means that it can be used with tools such as Gmail, Drive, Docs, and Calendar easily.
Do you need to organize your workflow in the most efficient way? A task manager will help you with it. Google Workspace task manager will fit specifically those who decided to stick to Google products. Does Google Workspace have a task manager or a project management tool at all?
Google offers its Google Tasks app, but it has many significant drawbacks. First of all, it is only available on mobile devices. Second, it is mostly a to-do list rather than a task manager. And speaking of more advanced functionality, it lacks the ability to create different views, make charts out of your tasks, etc. Kanbanchi is a good Google Tasks alternative because it doesn't have such drawbacks and is tightly integrated with the Google ecosystem.
A good task management tool will allow you to add in all of the information that is needed to complete the job: descriptions, dependencies, reminders, and the current status. The task manager can structure your approach to workflow in the best possible manner and reflect it visually. In fact, the better your task manager is, the less you think about actually managing your tasks. You just do them and perform the best way at your job, your school project, or any significant event planning.
In this case, Kanbanchi might be your best choice. It is a smart way of keeping track of everything that is going on. Additionally, the integration with Google services and tools is smooth and deep. Authentication with a Google account is easy and fast. You can attach any Google files to your tasks. All the files are securely stored on Google Drive. You can be sure that you are always fully in control of your projects and know exactly where you stand on each of them at any given time.
49. What is Enterprise Management System? Strategic Guide
Enterprise Management System (EMS), or just Enterprise System (ES), is, in a narrow sense, a software package that a large company or organization (enterprise) uses for its routine operations. Such systems support geographically dispersed IT infrastructures with many different processes that need to be maintained simultaneously. Usually, EMS includes several pre-installed software and apps that everyone in a company can use as corporate tools for cross-department collaboration.
Enterprise Management Solutions are different from those suitable for small and medium-sized organizations. However, there are tools designed to support your business at any scale, such as Google Workspace or Microsoft 365. Most EMS solutions include capabilities that support all core business areas. Sales, Customer Relations, HR, Project management, and others.
Usually, the Enterprise Management System is a package or set of tools that different departments use. They form a neat, connected infrastructure that allows people within the company to easily share their data, regardless of which group they belong to. An even better approach is to have a single flexible app that every group within a large enterprise can tune to meet their needs.
In this guide, we'll explore EMS in depth, and also showcase Kanbanchi - the app chosen by many enterprises.
Collaboration is the key to effective work and achieving aims. However, a lot of employees still have to work remotely. It causes vast negative effects to collaboration for the teams that are spread across various geographic and time zones. Here is the point where online collaboration tools will help a lot.
An online collaboration tool is an application allowing you and your teammates to work together and share data with each other online. Make it a part of your digital workplace and it will bring your partners, staff and clients together facilitating the achievement of your common goals.
Implementing a collaboration tool is sure to bring your organization a lot of benefits
As you can be anywhere and choose anytime to log in to a collaboration tool there’s no more need to move to the same location where the person you’re meeting is. So you can save some money on transport. And the case when you and the partner live in different cities or even countries might make the sun saved on travelling and accommodation quite serious.
Once logged in, such tool's features as task management and calendars allow you to control deadlines and don't forget about meetings and other important events. While communicating with your teammates or partners you have an opportunity to immediately record any necessary follow-up actions. The tool might even send reminders to ensure that these or that task or duty will be completed.
Collaboration tools also allow you to capture all your great ideas in one place and don't lose them. As such tools are usually easily searchable, you and your teammates can track down a required idea with ease.
A collaboration app will give you an opportunity to have document version control. Instead of sending a doc by email many times you just need to upload a document and assign your teammates. Now all of you can work together in real-time and reach the result you need much faster. Thus you can always be sure that all of you have the latest version of a document. You may also store all the related to the document comments in one place to simplify access and analysis.
With collaboration tools, you may have all the necessary work documents and data in one place. On the one hand, it increases security as you have total control over who has access to your data. You may set permissions, allowing only certain partners or teams to view a document or a range of documents. The teammates needn't send documents to each other, so a document can't be accidentally sent to the wrong person.
On the other hand, it highly increases productivity as it cuts down the time that you and the teammates spend searching for documents. It also makes notifications showing what should be done first of all. So all of you spend less time on different admin-related things. Thus you have more time for valuable tasks.
Make the right choice while you are looking for a collaboration tool is not easy. We suggest you give a try Kanbanchi. It is an easy-to-use collaboration and project management tool fully integrated into the Google ecosystem. The App contains an online Kanban board synchronized with a Time tracker, Gantt chart, Team Workload, and other views for more professional usage. Working with Kanbanchi, you can continue storing all your data on your Google Drive or Shared Drive, easily use it to raise your productivity, and needn't worry about safety.
Certainly, Kanban is a great tool to manage tasks in a productive way. It visualizes workflow stages and task statuses. However, the well-known "To do - Doing - Done" structure is not the only Kanban board example worth following.
How do you structure a Kanban board?
Depending on the ultimate goal, a Kanban board may evolve. Hence, classic Kanban can be enhanced with additional work stages, such as "backlog" and "blocked".
The next popular Kanban board example illustrates who is working on the project. In this case, columns are named after collaborators. This helps to keep track of team productivity and improve it. It perfectly fits small teams.
Frequently, the easiest way to structure a Kanban board is to define the steps built into the workflow. Typically, each task undergoes a distinct set of stages. A team can name columns on the Kanban board accordingly and easily monitor progress.
Development teams often use this approach. Definitely, a Kanban board structured this way visualizes the whole work process transparently. Here is a list of columns that a development team Kanban board may consist of:
Backlog
To discuss
Bugs
New features
Doing
Testing
Done
As is well known, Kanban is widely used for project management. Definitely, Kanban is a perfect tool to analyze the RAID log. RAID is an acronym that means Risks, Assumptions, Issues, and Decisions in project management. Altogether, the Kanban board for this purpose will consist of 4 columns. Additionally, setting priority on cards will define the sequence of work.
Teams practicing Agile tend to use Kanban. A Kanban board shows the flow of work, which is an important part of any Agile process.
What is the best way to use a Kanban board?
Kanban structuring is an ongoing process. Don't be afraid to experiment and make improvements. What fits your team right now probably won't fit you the next year. And this is an excellent advantage of Kanban - flexibility.
Eliminate sticky notes and opt for a digital Kanban instead. An online Kanban board keeps the team on the same page. Obviously, it makes remote team work possible.
Choose a tool that gives you the freedom to build your own workflow. If Kanban software sets lots of boundaries and limits your creativity, nothing good will come of it.
Ensure the software you've chosen features a gallery of ready-made templates. Additionally, it is great when you can create and save your boards as templates.
Kanbanchi is a Kanban tool that meets these criteria. Sign up to see for yourself!
Although Trello is a well-known tool, there are people who look for alternatives. There can be a number of motives for the switch. And one of them is the lack of integration with the G Suite environment. In order to use Trello for Google Workspace, you have to deal with power-ups: investigate the way they work and set them up.
Does Google have something like Trello?
Well, Google positions its products like everything that is needed to get anything done. However, there are reasons to doubt as these products alone might not be enough. Most likely, a dedicated productivity tool will be required for successful teamwork.
So, it becomes clear that Google doesn't have a tool similar to Trello.
What can I use instead of Trello for G Suite?
Try out Kanbanchi. It is a project management and team collaboration tool made specifically for Google Workspace (formerly G Suite). Kanbanchi integrates with Google immediately after sign up. Seamlessly and smoothly. And no snags with "power-ups".
Moreover, Kanbanchi uses Google account authentication. It means that your Kanbanchi password is never going to be lost.
Kanbanchi stores all data, projects and files securely in Google Drive. A Shared Drive storage option is available as well. Google files can be easily attached to tasks and opened with just one click. Access permissions don't present any difficulties - the same as Google offers.
Task dates can be added to Google Calendar. So Kanbanchi is a good option for those who rely on Google Calendar as a scheduling service.
Gmail is a trusted service. Frequently, the inbox contains valuable information that should not be lost. Kanbanchi addon for Gmail converts emails into tasks in seconds.
And great news for those who are ready to migrate from Trello - import from Trello is available in Kanbanchi. It will make the migration process go quickly and painlessly
A task board is a perfect solution for those who are tired of plain to-do lists and want to visualize their entire workflow. Task boards are universal, applicable to every area of business or life. We face task boards every day, actually, without maybe realising that this is it.
What Is a Task Board?
A task board is a tool that teams and companies use to organize their work and visualize the path they need to follow to achieve results, complete tasks, and more. Usually, this board has some form of organization, such as columns or lists, a calendar, or a timeline. A common approach for online apps nowadays is to represent each task as a card with customizable settings, allowing you to prioritize and sort your cards, as well as collaborate with team members.
The simplest form of a task board is a well-known to-do list. Serving well enough for individuals, it may not be enough for teams; that's why more complex task boards are well-spread across companies. Whether your team is involved in construction, development, or accounting, you may want to use a task board to track tasks and monitor progress.
A task board helps the team stay on the same page and work smarter.
Types of Task Boards
The most common is a simple Kanban board with three lists: To-Do, In Progress, and Done. These are general stages that all the tasks will go through. Starting with that, you can adjust it to your workflow by creating more lists between 'To Do' and 'Done'. Another popular way of using basic task boards is to name lists after periods of time, such as months or weeks. In this case, you will see all tasks that your team needs to complete during these periods.
The proliferation of task boards over the past decade has made it undeniable that online task boards are a great support for companies, especially for distributed teams with employees in different time zones. Boards consolidate all the information about projects, making them the primary platform for teams to collaborate. Any time, each team member can log in and catch up with the board, finding all the necessary information to perform their work in the best possible way. The option to break complex tasks into several subtasks without losing the ability to easily track all of them in one place, or to track relations between them, is another huge advantage of online task boards.
Why Use a Task Board?
A task board will help you to
Visualize workflows and manage projects easily - A task board stores all the information about your project, and you don't need to search for it and ask questions to team members all the time.
Increase team effectiveness and production - Once the task is done, you don't just through it away and start another one. You have gained some experience, and you have a foundation on which you will build your future work. And it leads you to the precious process of continuous improvement.
Always stay updated on the process - The Task board is meant for collaboration; it provides space for teams where they record all their activities. Looking at the board, you will get a clear picture of what is going on on a project.
Meet the deadlines - Tasks are time-sensitive; therefore, you need to clearly identify deadlines and communicate them to team members. A task board will become a great tool for that since all the deadlines are visible and are all in one place.
Reduce time and resource waste - When you use a task board, you are always aware of which tasks consume more resources (time or human), you are always able to make a shift in a project and reduce waste.
Who Uses Task Boards?
It won't be an exaggeration to say that everyone has ever used a task board. At least we all have calendars on our smartphones. Have you ever used it?
There are various apps on the market. Kanbanchi is unique in its kind because it has tight integration with Google Workspace.
54. What are key features of productivity applications?
Productivity software was worked out to provide a hassle-free work experience for individuals, organizations, and corporations. At the same time, it should help them follow through with their daily tasks efficiently. Modern productivity applications combine project management, task calendar, file sharing, and other features required for managing projects and use the team's resources effectively. It is especially important now as many companies continue working remotely.
However before you can take advantage of using the productivity software, you need to find the right PM tool for your team. But what features of productivity applications are truly needed?
Here are 7 key features of productivity applications we advise you to pay attention to:
- Intuitive use. The App should be intuitive and easy enough to be used on a daily basis. So that all the team members could enjoy using the application instead of hating it for the added stress.
- Customizable views. Organized in the right for you way Kanban boards and other views into your projects will help you to prioritize the projects and keep everything under control.
- Several views. The opportunity to view a project by timeline, across the whole team, and by individual team members ensure qualitative progress tracking.
- Recurring tasks give you an opportunity to set ongoing monthly, weekly, or daily tasks according to the requirements of your workflow. So you needn’t manually recreate tasks performed on a regular basis.
- Tasks via Email. The ability to create tasks by email saves a lot of time. But it is especially helpful when you have no opportunity to open the App itself.
- Reminders and notifications are necessary to avoid missing an important timeline or loss of essential information.
- Single sign-on with Google or Microsoft accounts simplifies the set up of a productivity application profile. It ensures a one-step login experience and quick access to your projects.
To get all the listed key features in one productivity application try Kanbanchi. It has Google sign-on, a familiar Google interface, and works within Google Drive. That's more Kanbanchi provides a great project management suite including Kanban board, List view, Gantt chart, and a Team Workload view. You can also use Archive, various Reports, Time tracker, and other useful tools for everyday workflow. The App also has Kanbanchi for Gmail add-on to create cards directly from Gmail. So is sure to help you do more with less effort.
The best definition of a Kanban board is "a workflow management tool that is used to visualise work at its stages". The two key elements of a board are cards and columns. Kanban cards usually represent tasks. Typically, columns represent stages on the board.
Why is It Called a Kanban Board?
The term comes from the Japanese “kanban” (看板), which means “signboard”. Here is a brief story of term creation. Japan, the 1940s: Taiichi Ohno introduced Kanban boards to Toyota, enabling it to effectively compete with American automotive manufacturers. The Kanban approach, along with Lean management, helped Toyota to increase productivity and reduce waste during production. The company still uses a Kanban board and even educates children about the Kanban and the Toyota Production System.
Who Uses the Kanban System?
Generally, Kanban layout depicts three columns:
To Do
Doing
Done
This layout is simple and covers the three main stages that all processes must overcome. Regardless of its nature, each goal-oriented activity needs them. This is why the Kanban board is a one-size-fits-all tool. You can monitor personal stuff on a board. The approach is equally good for individual users, start-up teams, and small businesses. Educators use the method for management-level staff and students. Enterprise companies tend to choose Kanban to ensure everyone fulfills their job.
What Kanban Board Tool Should I Choose?
Kanbanchi is an online project management software featuring a Kanban Board, Gantt Chart, and Time Tracker. Kanbanchi requires no installation, as you can access it directly in your browser. It is also widely used for team collaboration and task management because it provides a platform that all team members can access simultaneously. Kanbanchi complements Google Workspace apps and becomes part of Google's infrastructure. It also can be used with the Microsoft 365 ecosystem.
56. Best Google Tasks Alternatives in 2026: Top 15
Are you finding that Google Tasks doesn’t quite cut it when it comes to managing to-do lists, setting reminders, and organizing key project management tasks across multiple devices?
While it’s free and available for use across various Google platforms, Google Tasks doesn’t always offer the flexibility, control, and other features that some businesses require.
It’s common for businesses to search for a Google Tasks alternative. The good news, if you’re looking for tools to boost team performance, is that we’ve already done the legwork for you by sourcing 15 of the best Google Tasks alternatives on the market.
Let’s get straight into it…
What is Google Tasks and Why are People Looking for Alternatives to Google Tasks?
Google Tasks is a basic task management application and productivity tool that allows users to create, manage, and track to-do lists and tasks as part of project management.
The app is useful for businesses that need:
Integration with Gmail and Google Calendar: Tasks can be added directly from emails and viewed alongside calendar events.
Subtasks and details: Tasks can include subtasks, due dates, and additional notes.
Mobile and web access: Users can access the Google Tasks mobile app (iOS and Android) or from the sidebar in Gmail or Google Calendar on the web.
Google Workspace integration: The app seamlessly works with other Google services and is a convenient add-on for existing Google environments.
Discover the best Google Tasks alternatives in 2026 — modern tools that offer advanced task management, collaboration, and workflow automation
As a lightweight productivity tool, Google Tasks can assist professionals in quickly capturing tasks from anywhere, from any device, and tracking due dates and notifications.
So, why are Businesses Looking for Google Tasks Alternatives?
Small and medium businesses, startups, and enterprises often require more advanced task management tools as part of a comprehensive project management solution.
Google Tasks works best as a personal, professional or small-team productivity tool. It is not a project management platform and has some notable limitations, including:
No team collaboration features (no assigning tasks to others or comments).
No work visualization tools, like project timelines, Gantt charts or Kanban boards.
No subtasks, task dependencies or complex hierarchies.
No detailed project tracking or reporting/analytics.
No file sharing, labeling of tasks or activity tracking.
Limited organization (no labels, priorities or project-level views).
Only basic reminders for task deadlines.
No integration with third-party services.
Very few customization options, e.g., no color themes.
These are the main reasons why businesses may seek an alternative to Google Tasks. We cover the best 15 tools below but first, a word about how we chose these tools…
How We Choose the Best Google Tasks Alternatives?
The best alternatives can do what Google Tasks does — but other things as well, making up for some of the weaknesses outlined above.
Most of the Google Tasks alternatives we’ve chosen are free — or at least offer a free plan as part of their overall package. Most also offer mobile and web apps as standard.
As we compiled our list of 15 tools, we considered:
Pricing: the monthly costs and what the free plan offers, which is always a consideration for any business.
Integration capabilities: how easily the software integrates with third-party software, especially Google Workspace, which impacts the installation process and how smoothly everything operates afterward.
Special features: an assessment of the main features of each tool so that business owners and IT departments — especially those already using Google Workspace — can decide whether they are right.
Сustomization capability: how much the task management software can be personalized for individual business needs.
Overview of Top 15 Best Google Tasks Alternatives in 2026
Not all of the tools we cover below will be right for you. The following table offers an at-a-glance view of the best alternatives to Google Tasks. More detail on each tool is provided in the sections after the table if you need more of the nitty-gritty info before choosing the most suitable tool.
No deep integration with Google Workspace (designed for Mac environments).
Many customizations available for Mac environments.
Works seamlessly in Mac environment
Advanced task management & privacy features.
Capability to manage complex projects.
Kanbanchi
Kanbanchi is a visual task management tool that is deeply integrated with Google Workspace — and, therefore, a prime candidate as one of the best Google Tasks alternatives.
Kanbanchi’s flexible Kanban board transforms brainstorming into actionable plans — perfect for mapping out your Business Model Canvas visually
Built from the ground up for the Google work environment, small and medium-sized teams can not only manage tasks but do so by creating Kanban boards, Gantt charts, and task lists, collaborating in real-time, and tracking time all in one simple-to-use platform.
Kanbanchi allows agile teams, freelancers, and remote workers to coordinate and manage projects efficiently while switching seamlessly between Gmail, Google Drive, and Google Calendar.
Keep your team on the same page with real-time task updates — collaborate seamlessly, track progress, and hit deadlines together
Unlike standalone task managers, such as Trello, Kanbanchi operates inside Google Workspace, making it simple to turn emails into tasks, sync deadlines with Google Calendar, and attach Drive files directly to cards.
This native Google focus makes it ideal for businesses looking for more control over their project processes within the Google Workspace environment.
Standout Features:
Native Google Workspace integration: Seamlessly embeds within Google’s ecosystem (Gmail, Drive, Calendar, Docs) without switching tabs/apps.
Multiple work views: Kanban board, Gantt charts, and task list views according to the preferences/needs of teams.
Time-tracking and productivity reports: built-in time logging and analytics help businesses monitor efficiency.
Real-time collaboration: live team collaboration with zero latency, similar to working in Google Docs.
Customizable workflows: boards are adaptable for any process, such as software development, marketing, sales, HR, etc.
Pros:
Deep Google integration (Gmail to tasks in one click).
Multiple views in one tool.
Affordable pricing.
Utilizes Google
Cloud infrastructure with security compliance.
Minimal learning curve.
Cons:
Mobile app is basic (the web version is stronger).
No built-in chat (relies on Google Meet/email).
Team Size Scalability
Best for: all team sizes.
Pricing
Free plan: Limited to 36 cards
Paid plans:
Essential: $3.97/user/month*
Premium: from $6.47/user/month
Professional: from $24.47/user/month
Enterprise: from $12.95/user/month
*All prices quoted in this article are based on annual pricing.
Trello, part of the Atlassian suite of software solutions, is another visual task management tool often used by freelancers, and small and midsized teams when managing projects.
Within the Google ecosystem, Trello works but it is not natively integrated (like Kanbanchi is). Power-ups are needed for integration. This increases the learning curve for users and means that some of the tasks get a little “clunky”, such as attaching Google Drive docs to Trello cards.
Trello’s intuitive Kanban boards turn your Business Model Canvas into a visual, drag-and-drop workflow — simple yet powerful for any team
With Trello, it’s easy to visualize tasks and workflows and the free plan offers most of the features that individuals or small teams look for in free task management tools, though not necessarily within a Google environment.
Standout Features:
Power-ups for integrations with Google Drive, Gmail, Google Calendar, Google Meet, etc.
Kanban board and list views for work organization.
User-friendly interface on web, mobile, and desktop.
Pros:
Integrates with Google Workspace through add-ons (power-ups).
Collaboration-friendly with task assignments, comments, due dates, attachments, etc.
Easy to organize and view workflows.
Performs well across web, mobile, and desktop platforms.
Cons:
Learning curve with power-ups.
Potential security/privacy issues for unpaid versions.
Team Size Scalability
Best for: Small to midsize teams (5-50 users).
Pricing
Free plan: Basic features for up to 10 collaborators per workspace.
Paid plans:
Standard: $5/user/month
Premium: $10/user/month
Enterprise: $17.50/user/month
ClickUp
ClickUp is a comprehensive, all-in-one platform for productivity and collaboration on projects. Although one of the best free Google Tasks alternatives, this tool is far more advanced and does a lot more than simple task management.
For instance, it offers multiple work view options, such as Kanban boards, Gantt Charts, calendar views, mind maps, and lists. Its task management features allow you to track changes, create schedules, and create reports.
ClickUp combines task lists, statuses, and automation to help teams structure even the most complex workflows with ease
While that may sound like a plus, a centralized work hub like this may be overkill for some professionals or small businesses simply requiring basic task management tools. ClickUp’s advanced features and steep learning curve may be more suited to midsize to larger businesses and enterprises.
Standout Features:
Multiple work views including mind maps, Kanban boards, Gantt Charts, lists, etc.
Supports tasks, subtasks, checklists, dependencies, time tracking, goals, etc.
Can track changes, create schedules, and create reports.
Pros:
Easy to assign tasks to teams.
Flexible with multiple work views.
Scalable for larger teams.
Collaboration-friendly with checklists, whiteboards, attachments, comments, etc.
Highly customizable with advanced features.
Cons:
Steep learning curve with so many features.
Occasional Google Workspace integration issues as it’s not native.
Confusing or cluttered user interface for some users.
Team Size Scalability
Best for: Midsize to large teams (50-500 users)
Pricing
Free plan: Basic features with 100 MB of storage space.
Paid plans:
Unlimited: $7/user/month
Business: $12/user/month
Enterprise: Custom pricing
Wrike
Wrike is another high-level alternative to Google Tasks, It is impressive in its scalability and well-suited to midsize or larger organizations with complex project management demands — but may be overkill for smaller organizations or individuals looking for simple task management tools.
Wrike’s detailed task lists make managing big initiatives like product relaunches clear and trackable — keeping every milestone in view
Wrike bills itself as an all-in-one platform for managing projects, organizing workflows, and enhancing team collaboration. Ideal for medium to large teams that require secure, scalable project management with advanced reporting and collaboration tools, Wrike also offers custom solutions for enterprises.
Standout Features:
Custom dashboards, workload charts, time tracking, and real-time reports.
Enterprise-grade security and permissions.
Extensive collaboration tools, including real-time editing, sharing, and team communication tools.
Pros:
Integrates with third-party apps such as Google Drive, Microsoft Teams, Dropbox, etc.
Comprehensive and customizable project management tools and interfaces.
Advanced reporting features for performance tracking.
Robust security and privacy.
Well-developed mobile app available (Android and iOS).
Cons:
More expensive starting point for paid versions.
Not Google-focused with its integrations.
Overkill for smaller teams, with a steep learning curve when onboarding.
Occasional speed issues reported.
Team Size Scalability
Best for: Midsize to large teams (50-500 users).
Pricing
Free plan: Basic features but limited to 200 active tasks, including subtasks.
Paid plans:
Team: $10/user/month
Business: $25/user/month
Enterprise/Pinnacle Plans: Custom pricing
Zoho Projects
Zoho is a well-established name in CRM software and Zoho Projects is part of a growing suite of 45+ tools that help businesses manage work, customers, employees, and business processes.
Zoho Projects’ task lists give your team a clear overview of responsibilities, deadlines, and project milestones — all in one place
While Zoho Projects is not focused on task management, it may be a viable alternative to Google Tasks for small to mid-sized businesses and enterprises that already use the Zoho ecosystem for CRM, recruitment or sales.
The software allows you to plan and manage tasks, teams, and timelines with several workflow views and extensive collaboration from one central platform.
Standout Features:
Project template library.
Blueprints to map out complicated tasks.
Extensive synching with other Zoho tools and Google Workspace.
Pros:
Good for complex tasks.
Scalability with an extensive feature set and many potential integrations.
Lower starting pricing than most other project management tools.
Many customization options.
Ticket-based support system with extensive user community.
Cons:
User-unfriendly interface for some users.
Not Google-focused.
Team Size Scalability
Best for: Midsize to large teams (50-500 users)
Pricing
Free plan: Basic features for up to 3 projects and 5GB of storage
Paid plans:
Premium: $4/user/month
Enterprise: $9/user/month
Smartsheet
Smartsheet is another of the Google Tasks alternatives suitable for larger organizations, government agencies, and enterprises. These organizations often require wider project management software in addition to all the features of standard task management tools.
Smartsheet’s simple checkbox system turns everyday task tracking into a powerful, spreadsheet-style project management tool
With a familiar spreadsheet-based system, multiple work views, a large template library, and extensive integrations, Smartsheet is secure, scalable, and customizable for businesses that need to manage, automate, and report on tasks within work projects.
Smartsheet integrates with Google but has a relatively low rating from Google Workspace Marketplace users.
Standout Features:
Spreadsheet-based interface with simple drag-and-drop functionality.
Powerful teamwork collaboration tools.
Extensive automation tools for workflows and document generation.
Pros:
Extensive integrations available.
Simple transition for professionals using Excel/Google Sheets.
Good for collaboration and automated workflows.
Scalable for large organizations.
Enterprise-ready with advanced security.
Cons:
No free version (though free trials available).
Low Google Workspace rating from users.
Steep learning curve with more advanced features.
Team Size Scalability
Best for: Midsize to large teams (from 50-500 users)
Pricing
Free plan: Basic features for up to 10 collaborators per workspace.
Paid plans:
Pro: $9/user/month (1-10 members)
Business: $19/user/month (3+ members)
Enterprise: Custom pricing (10+ members)
Notion
Notion is an all-in-one workspace that can act as a simple Google Tasks alternative — or a tool that does much more besides, including note-taking, project management, database creation, and collaboration.
Notion was not designed for task or project management, but teams now use it widely to manage projects in a highly customizable and automated environment.
Notion’s flexible notes and task databases help you organize work processes, brainstorm ideas, and manage projects in one connected workspace
Notion lets you build task databases, boards, lists, calendars, and tables, and add properties like priority, status, tags, deadlines, or assignees to tasks. This goes far beyond Google Tasks' capabilities. Multiple work view options, collaboration tools, and templates may be overkill for users looking for a tool for quick tasks and reminders.
Standout Features:
Build task databases, boards, lists, calendars, and tables from a modular interface.
Extensive project management and built-in collaboration features.
AI automation and prebuilt templates.
Pros:
All-in-one workspace for tasks, notes, project documentation, databases, and wikis.
Good for deep task management and collaboration.
Flexibility from many customization options.
Many automation options to speed up tasks.
Vibrant ecosystem of free and paid templates.
Cons:
Free version limited to individual usage.
No native Google integrations.
May be slower (more clicks) than Google Tsks for quick tasks.
Team Size Scalability
Best for: Individuals and small to midsize teams (5-50 users).
Pricing
Free plan: Basic features for individuals.
Paid plans:
Plus: $10/user/month
Business: $20/user/month
Enterprise: Custom pricing
Monday.com
Monday.com is an easy-to-use and free Google Tasks alternative that can also be used as project management software. It’s particularly geared towards individuals and small and medium businesses with non-complex projects.
Monday’s flexible notes and task databases help you organize work processes, brainstorm ideas, and manage projects in one connected workspace
For setting deadlines, assigning tasks and resources, and tracking tasks, Monday.com works well. If you want it to do more than that, you’ll need to be a little more tech-savvy to customize the software for your needs — but it can operate as a fully functional project management tool.
Standout Features:
Clean, colorful user interface.
A library of in-built templates and tools for task and project management.
Real-time view of task statuses, time tracking, and performance analytics.
Pros:
Engaging design and easy-to-use interface.
Allows simple and effective team collaboration.
Streamlines work processes.
Customizable workflows, dashboards, and task fields.
Cons:
No native Google Workspace integrations.
No native proofing features.
Individuals may find it overkill for simple task management.
Team Size Scalability
Best for: Small to mid-sized teams and large enterprises (from 5-500 users)
Pricing
Free plan: Basic features for up to 2 users and 3 boards.
Paid plans:
Basic: $9/user/month
Standard: $12/user/month
Pro: $19/user/month
Jira
Jira is another task management tool from the Atlassian “stable”. It was originally built to track issues in software development but has morphed into more of a full task-tracking and management tool for a range of issues and work items.
Jira’s robust Kanban boards bring structure to your Business Model Canvas — ideal for agile teams who need transparency and control
Like many of the Google Tasks alternatives outlined here, Jira offers multiple work views and good customization options. However, there’s no escaping its use mainly in the tech, software design, and ops fields, where issue tracking is a priority and issues can be complex.
For simple task management needs in other types of businesses, therefore, Jira may be overkill.
Standout Features:
Detailed task history, priorities, and reporting available.
No-code automation builder.
Extensive integrations and marketplace.
Pros:
Easy to plan and organize tasks.
Designed to track project issues at scale.
Customizable fields, workflows, issue types, views, screens, and layouts.
Easy to prioritize and check progress on issues.
Good for small teams with complex workflows.
Cons:
Integrations are geared towards the Atlassian marketplace.
Mobile app is not as good as the desktop or web app.
Mainly used in IT, software design, and tech.
Team Size Scalability
Best for: Small to mid-sized teams and large enterprises in the tech space (from 5-1,000 users)
Pricing
Free plan: Basic features for up to 10 users with 100 automations/month.
Paid plans:
Standard: $8.60/user/month
Premium: $17/user/month
Enterprise: Custom pricing
ToDoist
ToDoist is a true alternative to Google Tasks in that it is designed predominantly as a task management app. It does not offer many of the features of the other project management software tools included in this list but, as the name suggests, it does help businesses manage to-do task lists.
ToDoist makes structuring your business model simple with intuitive task lists and easy status tracking for daily productivity
Because of its focus solely on task management, ToDoist is a useful tool for professionals and teams looking to prioritize tasks and become more productive without a learning curve. However, if you need more advanced team collaboration and project functionality, you’ll be better off with a more advanced tool.
Standout Features:
“Favorites” function helps users focus on key tasks.
Priority levels, due dates and times, sub-tasks, and task reminders.
Basic task views including lists, boards, and calendars.
Pros:
Simplicity — easy to add tasks and recurring due dates.
Totally focused on task management (like Google Tasks).
Basic task collaboration available.
Several task views available.
Cons:
May be too basic for some users.
Only tasks can have due dates — not projects.
No native Google Workspace integration.
AI assistant only in paid plans.
Team Size Scalability
Best for: Small teams focused on task management (5-10 users).
Pricing
Free plan: Basic features for up to 5 personal projects.
Paid plans:
Pro: $4/user/month
Business: $6/user/month
Any.do
The Any.do app is designed as a task management alternative to Google Tasks, helping with personal tasks, family projects, and teamwork. Its focus on task management (anywhere — not just in businesses) rather than project management makes it one of the simpler tools covered in this review.
Any.do’s clean task lists and reminders help you organize workflows, stay on top of priorities, and keep your business model on track
Despite a focus on personal use, grocery lists, and families, Any.do does offer some collaboration tools and alternative work views to simple lists, such as Kanban boards in the paid plans.
Standout Features:
Tasks and lists made simple.
Calendar and daily planner.
Widgets to help with events, tasks, meetings, etc.
Time-based, location, and recurring reminders.
Pros:
Simplicity and focus on task management.
New tools added frequently — particularly for automation and collaboration.
Cross-platform availability.
Clean, user-friendly interface.
Custom views and templates available.
Cons:
Not solely focused on businesses.
May be overly simple for larger teams.
No native Google Workspace integration.
Limited collaboration tools available.
Team Size Scalability
Best for: Individuals, families, and small teams (5-10 users).
Pricing
Free plan: Limited features for individuals.
Paid plans:
Premium: $4.99/user/month
Family: $8.33 for up to 4 users/month
Teams: $4.99/user/month
Remember the Milk
Remember the Milk is a lightweight yet powerful task tracker — perfect for staying on top of to-dos at home or at work
With a simple free version and a more feature-heavy paid version available, the RTM software is targeted at individuals, solo professionals, entrepreneurs, freelancers, and families who want a simple but robust task management tool with some additional features over and above what Google Tasks offers.
Standout Features:
Smart lists (dynamic filters).
Reminders, notifications, tags, priorities, and locations.
Subtasks and recurring tasks.
Pros:
Simple but powerful user interface.
Integrates with Gmail and Google Calendar.
Can share lists and assign them to other people.
Cons:
Advanced features require a paid plan (e.g., subtasks, advanced filters, unlimited sharing).
Not focused on teams or businesses.
No native Google integration.
Customization mainly in Pro plan.
Team Size Scalability
Best for: Individuals, entrepreneurs, freelancers, and families (1-4 users)
Pricing
Free plan: Basic features
Paid plans:
Pro: $49.99/user/year
TasksBoard
TasksBoard (not to be confused with the open-source software, Taskboard) is specifically designed as a desktop app for Google Tasks and integrates natively with Google Workspace. You sign in with Google, meaning that no passwords are stored by the app itself.
TasksBoard utilizes a simple Kanban-style board for task management. The app is aimed at personal users, professionals, and small teams. The paid plans can handle tasks for multiple projects but larger teams or organizations may want something more feature-heavy with more collaboration and project management tools.
Standout Features:
Google Tasks viewed in a full-screen Kanban board.
Share Google Tasks lists in real-time with one link.
Organize and prioritize tasks with labels.
Pros:
Fully integrated with Google Workspace.
Syncs across all devices.
Customizable labels and tags make task sorting and prioritization simple.
Secure — no passwords stored.
Cons:
Limited advanced features.
No native Google Workspace integrations.
Not suitable for large teams/projects.
Team Size Scalability
Best for: Individuals, professionals, and small teams (1-10 users).
Pricing
Free plan: Up to 5 shared lists for personal users.
Paid plans:
Personal Pro: $3.99/month
Team: $4.99/user/month
TickTick
TickTick is another well-established alternative to Google Tasks, offering an advanced way to manage both the practical and creative side of work/home projects and designed to capture ideas as well as organize tasks.
TickTick helps you capture ideas and organize tasks effortlessly — balancing creativity with practicality for productive workflows
You can manage to-do lists, view calendars, track time (Pomodoro style), and share lists with colleagues. Although it’s more advanced than Google Tasks with its features and functionality, TickTick lacks many of the extra collaboration and project management tools of some other solutions outlined here.
Standout Features:
Drag and drop schedule planner.
Multiple calendar views.
Constant and repeat reminders.
Habit library to help users build good habits.
Pros:
Advanced task management.
Focus and productivity tools, including Pomodoro timer, habit tracker, etc. (paid version).
Basic collaboration tools available (list sharing).
Some customization options.
Cons:
Many of the best features are locked behind the paid plan.
Limited collaboration tools.
Lack of deep Google Workspace integration.
Team Size Scalability
Best for: Individuals, professionals, and small teams (1-20 users)
Pricing
Free plan: Basic features (limited lists, tags, etc.)
Paid plans:
Premium: $39.50/user/year
OmniFocus
OmniFocus is a powerful, professional-grade task manager but is predominantly geared towards Apple-using (macOS, iOS) professionals. It works entirely offline and syncs later so is ideal for remote users, as well as privacy-conscious organizations.
OmniFocus is built for Apple users who want to master their tasks — manage priorities and stay focused across macOS and iOS
This tool is built around the "Getting Things Done" (GTD) workflow method and the web app seems almost like an afterthought. The tool has been designed for iPhones and iPads, with no native Windows, Android or web interface until recently. However, in Mac environments, it can easily handle complex projects if you don’t mind a steep learning curve.
Standout Features:
Defer dates, sequential task logic, custom filters, etc.
Custom views ("Perspectives") using multiple filters.
Project and task nesting (deep hierarchies).
Offline-first functionality.
Pros:
Works seamlessly in an Apple environment.
Advanced task management features.
Capability to manage complex projects.
Privacy: works offline and syncs later.
Cons:
Mac-only target users.
No native Google Workspace, Windows or Android integrations.
Non-user-friendly interface.
No free plan (free trial offered).
Steep learning curve.
Team Size Scalability
Best for: Small to mid-size teams (5-50 users) in Mac-only environments.
Pricing
Free plan: None
Paid plans:
$99.99/year for a subscription for Mac and Web or $49.99/year just for Web.
That completes our overview of 15 Google Tasks alternatives. Which solution suits you best depends on your priorities and goals with the software, your work environment, the team size, and your budget.
For Google Workspace environments, Kanbanchi is one of only a couple of alternatives to Google Tasks specifically designed to work seamlessly in Google environments by small to mid-sized teams.
Purpose-built around the Kanban board methodology, Kanbanchi was designed for user-friendly task management, team collaboration, and seamless project management within the Google Workspace ecosystem, making it the number one choice as a budget-friendly or free Google Tasks alternative.
57. What are the five programs included in Google Drive Suite?
Google Drive Suite, now also known as Google Workspace, is a package of reputable business productivity features. It includes Gmail, Google Sheets, Google Docs, Google Forms, Google Slides, Google Calendar, and Google Hangouts. Most of us can easily create a presentation on Google Slides and know how to schedule a regular company-wide meeting using Google Calendar. Using Google Workspace basic functionalities is easy and natural for millions of people. But there are several less obvious Google Workspace features that might significantly increase your productivity. Here they are.
Share Files Directly via Gmail
You are likely to have encountered the following issue: you need to send files via email, but you're unable to do so because you've reached Gmail’s 25 MB attachment limit. Google Workspace gives you an easy workaround. Just upload files to your Google Drive and click the Drive triangle icon located at the bottom of your message draft. This direct share function allows you to send files worth up to 10 GB. Now you can always send your video report or presentation on time!
Minimize Context-Switching with Research Pane
When you conduct research, do you open so many tabs in your browser that it starts to freeze? Does that sound familiar? For sure! And of course, an additional monitor in such a situation would certainly simplify the work. Using only one screen leads to regular context switching, which often causes distraction and, as a result, postponement. Google Docs’ Research Pane will help you to stay on task and be more efficient. The option enables you to open Google Search right from a Google Doc. You can even embed an image or add a link right from the pane — simply drag and drop!
Integrate Google Workspace With Your Social Apps
Google Drive Suite smoothly integrates with social media platforms, especially YouTube and Facebook. You, of course, know that Facebook has a Workplace platform. This social network for business features a messaging tool, Groups, and a News Feed. And so, the platform is integrated with Google Workspace in a way that allows you to sign into Workplace using your Google account.
Use Collaborative Whiteboard
Google whiteboard, powered by Suite apps, is quite expensive. However, Jamboard allows you to select images from your Google Drive and display them directly on the screen with ease. The whiteboard can recognize shapes and handwriting. It also supports easy saving and sharing via Google Hangouts. With such a board, you needn't worry anymore that one of your colleagues might accidentally erase your vital work!
Improve Your Productivity With Google Add-Ons
Besides various Google Workspace features, there are also many complementary Apps and Add-Ons perfectly integrated with Google but built by third-party developers. The Marketplace gives you the chance to find and install whatever you need to expand the functionality of Google features. We invite you to pay special attention to Kanbanchi. It is an easy-to-use project management tool fully integrated into the Google ecosystem. The App contains an online Kanban board synchronized with a Gantt chart, Time tracker, Team Workload, and other views for more professional usage.
It's up to you to decide which features and Add-Ons to integrate into your workflow. However, it is clear that integrating Google Workspace with your other apps allows you to effortlessly transfer content and data between them. Thus, everything will be where you want it to be, and you will be able to work more effectively.
Enterprise project management in its general meaning is a system of managing projects in large companies with over 1000 employees on a company-wide scale. In the current ever-changing environment, enterprise project management main goal is to make organizations flexible and able to adapt to transformations.
It's very common that large enterprise companies run multiple projects simultaneously. These projects may at the first glance seem not connected but in the end, they are all related. They all exist for the benefit of the same company, and they are all working towards the same goal. That’s why large enterprises need to have a system that allows managing different projects and connect all parts (departments) of a company.
According to the Project Management Institute (PMI), there are several initiatives that a large company should perform in order to have a sustainable project management system:
Why enterprise project management is different from general project management?
The key point is that a general project management approach is to have one project. This project has its goals and the tasks that you need to do to reach those goals. Enterprise project management has to deal with multiple goals of multiple departments/teams. All these goals in the end help to achieve broader organizational goals. General project management focuses on goals achievement, and project success is defined by them. When you deal with projects within one large enterprise, there may be times when the goals of one particular project won't be met. But the overall success is not defined by that.
Project management system established within large companies should be flexible and follow agile principles. Ideally, it should allow changing goals and objectives on the go as the environment evolves every second. When a company grows it tends to become slower. That's why it's very important for it to have a project management system allowing fast changes and flexibility.
Implementation of enterprise project management
Successful implementation of enterprise project management starts with a thorough review of all existing projects, tools that a company uses and its organizational culture. Sometimes, you should perform serious transformations in a company even before adopting any special project management tool. Organizational culture should be ready to embrace the possibility of changes and the agile approach.
Only when you have done all the internal preparations, a company should think of a project management app that can support all the projects and be flexible enough to suit every team in a large company.
Ready for a transformation? - Try the power of Kanbanchi and G Suite?
59. Does Google Workspace project management tool exist?
There's continued growth in Google Workspace users worldwide. It's inevitable that the question arises about a project management tool within a corporate suite. Large companies switch to Google Workspace and ask: "Is there a Google Workspace project management tool within the space?" They need an app that works in cohesion with their Workspace.
If you are asking the same question, you aren't alone in that search!" Thousands of project managers, agency owners, and team leads like you are seeking that missing piece. A way to manage projects with professional-grade features, like Gantt charts and Kanban boards, without having to export their work into a separate, disconnected software island.
The term Kanban in a well-known methodology comes from the Japanese “kanban” (看板), which means “signboard”. The best definition of Kanban board is "a workflow management tool that is used to visualise work at its stages". The two key elements of a board are cards and columns. Kanban cards usually represent tasks. Typically, columns represent stages on the board.
Why is Kanban used?
The layout is very simple and covers the three main stages all the processes are to overcome. Generally, Kanban layout depicts three columns:
To do
Doing
Done
Regardless of its nature, each goal-oriented activity needs them. This is why Kanban board is a one-size-fits-all tool. You can monitor personal stuff on a board. The approach is equally good for individual users, start-up teams and small business.
The overall idea of any Kanban board is that the tasks move across the board as they progress. It is a question of finally reaching the Done column once the task finishes, so it should be very easy to track the progress from start to finish. It is worth bearing in mind that the first boards of this type were developed in the 1940s as a simple planning tool, which is still the main focus that they have today.
Kanbanchi for Google Workspace is the online project management software with Kanban Board, Gantt Chart and Time Tracker. Kanbanchi needs no installation because you can access it in your browser. It is also widely used for team collaboration and task management because it provides a platform that all team members can access at one time. Kanbanchi complements Google Workspace apps and becomes part of Google's infrastructure.
Kanbanchi is built specifically for Google Workspace. You sign up with your Google account, manipulate your project boards as files in Google Drive, give flexible access permissions, create events in your Google Calendar, attach Google docs, sheets and forms to your boards, and more.
61. Does Google Workspace have a project management tool?
Google Workspace is a powerful pack of apps for corporate users that's been around on the market for quite a while. However, the pack doesn't include any Google Workspace project management tool. Which opens a wide range of opportunities for smaller yet not less great companies, like Kanbanchi.
The same-named app is designed specifically for Google Workspace users. It provides them with the project management solution within the familiar environment.
If we look at the search level for "google workspace project management", we'll understand that there's a great demand for an app integrated with Google's pack.
What people are searching for?
The main point of search is to find an app that's easy to use and which will operate the same way Google Workspace works. Kanbanchi works in Google Drive and acts exactly like any other file that you put inside your Drive. You can create boards for your projects and then open and share them from your Drive as well as from within the app. It helps to master the app in less than 15 minutes.
Kanbanchi board and its special folder inside the user's Google Drive
The most common request from project managers working in companies that use Google Workspace is to have an app that supports a kanban board, Gantt chart or resource board. At the same time, they need to attach files from Google Drive and synchronize them with Google Calendar.
Do you recognize your requests?
Then, Kanbanchi is a perfect fit for you! It has all these features in one and is even powered with real-time synchronization. It makes collaboration extremely smooth and transparent so that Kanbanchi soon will become the tool for everyday usage of all your team.
Want to try the power of Kanbanchi and Google Workspace?
What does Gantt stand for? Gantt is the last name of Henry Gantt who introduced the first chronological chart as a project management system. As it often happens, the name since then is widely used to describe such kind of charts. Gannt, or Gantt chart, in its simple form, is a horizontal bar chart that shows a project plan on a timeline. You will see all the tasks in your project in chronological order and will easily understand it. Gantt charts are widely used in project management and team management.
Simple Gantt chart made in Kanbanchi app
Do I need a Gantt chart?
The most popular question among project and team leaders is whether they need a Gantt chart at all. First of all, decide if your project is time-sensitive. Most of the modern projects are. Your client, managers or stakeholders won't wait forever until you have perfectly done your job. The agility of a modern world puts all teams under the pressure of schedules and deadlines. This pressure becomes higher when you are not only responsible for your own tasks but also for the tasks that your teammates are doing.
If you are responsible for a long and complex project that involves many people, then most likely that having a visual Gantt chart will help you to achieve better results. You will not overload your team, you will save much time, and you will never get lost.
The times of paper and pen Gantt charts are long gone. Our constantly changing world and environment demand tools that can adjust. Tools that allow not only to create an initial draft of your project but to make changes at any stage. Online tools do it the best. There are plenty of Gantt chart apps out on the market. You may choose from the apps that provide only the creation of separate Gantt charts, as well as from the apps integrated with other useful tools.
Specific online tools that provide only Gantt charts
Apps that cover multiple functions and can be used for creating Gantt charts as well (like Excel, for example)
Tools for project management and teamwork that cover all the needs including creating the Gantt chart
What does Gantt stand for in Kanbanchi?
Gantt charts in Kanbanchi may support all kinds of projects, from the simplest to the most complex ones. In addition to the tasks on a timeline, you will be able to monitor the progress of the tasks, check the deadlines and quickly reschedule when needed. The chart will show you dependencies and relations between tasks.
Start using Kanbanchi for your projects and team management. You will see how simple are complex things when you have the right tools. Sign-up to have a free trial.
Google offers plenty of various services intended to help its clients in their everyday life and business. G Suite pack contributes to users' scheduling, productivity and collaboration all over the world. It covers many needs but moving forward to take a business to new heights demands more serious and professional tools to manage daily tasks and challenges. Therefore the question arises "Does Google have a task manager?". Unfortunately, Google can't provide it.
How to cope without a Google Task manager?
Don't even think about it! The lack of a professional Task manager among the Google services, the need, and demand of it led to the development of several third-party tools. The most remarkable among them is Kanbanchi.
Why Kanbanchi is the perfect Task manager?
Kanbanchi is a clear organized system for monitoring and managing the workflow, suitable for both one person and a large team. The Apps' users get all the opportunities of an online Kanban Board. What's more, they also can enjoy such advanced features as Gantt chart, Time tracker, several types of Reports, Archive and some others.
Why Kanbanchi is the best choice for Google users?
It is also very important that the application was developed and made specifically for more comfortable work with G Suite. Familiar Google-like interface and integration with G Suite features make Kanbanchi an easy-to-start application for all Google users.
Do you need to organize your workflow in the most efficient way? A task manager will help you with it. The task manager can structure your approach to workflow in the best possible manner and reflect it visually.
A good task management tool will allow you to add in all of the information that is needed to complete the job: descriptions, dependencies, reminders and the current status.
If you’re into the Google ecosystem and work with GSuite on a daily basis you need a Google task manager with tight integration with this environment.
In this regard, Kanbanchi might be your best choice. It is a smart way of keeping track of everything that is going on. You can be sure that you are always fully in control of your projects and know exactly where you stand on each of them at any given time.
The best definition of a Kanban board is "a workflow management tool that is used to visualise work at its stages". The two critical elements of a board are cards and columns. Kanban cards usually represent tasks. Typically, columns represent stages on a board.
Why is it called a kanban board?
The term comes from the Japanese “kanban” (看板), which means “signboard”. Here is a brief story of term creation. Japan, the 1940s: Taiichi Ohno introduced Kanban boards to Toyota to compete effectively with American automotive manufacturers. Kanban approach along with Lean management helped Toyota to increase productivity and reduce waste during production. The company still uses the Kanban board and educates children about Kanban and Toyota Production System.
Who uses the Kanban system?
Generally, the Kanban layout depicts three columns:
To Do
Doing
Done
This layout is simple and covers the three main stages all the processes are to overcome. Regardless of its nature, each goal-oriented activity needs them. This is why the Kanban board is a one-size-fits-all tool. Personal stuff can be monitored on a board. The approach is equally suitable for individual users, start-up teams and small businesses. Educators use the method for staff and students. Enterprise-level companies tend to choose Kanban to make sure everyone fulfils the job.
What kanban board tool should I choose?
Kanbanchi is an excellent example of a digital Kanban board. All Kanbanchi boards have three classic Kanban lists.
However, this model is optional, and you may easily rename the lists and add extra ones. Also, the Kanbanchi interface is intuitive and is just as easy as sticky notes with a whiteboard.
Physical Kanban has simply run its course especially when remote work has become widespread. Such online Kanban software as Kanbanchi provides users with many more opportunities, e.g. epic & subcards, priorities, time tracking, the ability to assign tasks, monitor team workload, and export data to create reports. Kanbanchi stores user data in Google Drive and can also create auto backups.
G Suite is a powerful pack of apps for corporate users that's been around on the market for quite a while. However, the pack doesn't include any gsuite project management tool. Which opens a wide range of opportunities for smaller yet not less great companies, like Kanbanchi.
The same-named app is designed specifically for G Suite users. It provides them with the project management solution within the familiar environment.
If we look at the search level for "gsuite project management", we'll understand that there's a great demand for an app integrated with Google's pack.
What people are searching for when they search for Gsuite project management?
The main point of search is to find an app that's easy to use and which will operate the same way G Suite works. Kanbanchi works in Google Drive and acts exactly like any other file that you put inside your Drive. You can create boards for your projects and then open and share them from your Drive as well as from within the app. It helps to master the app in less than 15 minutes.
Kanbanchi board and its special folder inside the user's Google Drive
The most common requests from project managers working in companies that use G Suite is to have the app that supports a kanban board, Gantt chart or resource board. At the same time, they need to attach files from Google Drive and synchronize their apps with Google Calendar.
Do you recognize your requests?
Then, Kanbanchi is a perfect fit for you! It has all these features in one, and even powered with real-time synchronization. It makes collaboration extremely smooth and transparent so that Kanbanchi soon will become the tool for everyday usage of all your team.
No, Google does not have its own project management app. Google Workspace (formerly G Suite) provides valuable tools for collaboration and productivity, like Gmail, Drive, Docs, Sheets, Calendar, Meet, and Chat, but a dedicated project management tool is still a significant gap in the suite.
What does Google offer instead?
Some teams adjust built-in tools like Google Sheets for project management purposes. While Sheets is flexible and easy to share via Drive, it is still a spreadsheet, not a purpose-built project management system. For anything more complex than a simple task list, it tends to break down quickly.
What Project Management App should Google Workspace users use?
Kanbanchi stands out as the solution designed specifically for this gap. It offers easy authentication through your Google account and integrates directly with Google Drive and Google Calendar. Kanbanchi cards can have any Google file attached. Emails can also be converted into tasks directly from Gmail using the Kanbanchi for Gmail add-on.
Kanbanchi supports multiple project management approaches with a range of built-in views, including a Kanban board and a Gantt chart, making it a seamless fit where a Google project management app is missing.
For a full explanation of how Google Workspace teams can set up project management and what to look for in a tool, read the complete guide here.
If you feel the lack of a native Google project management tool, check out Kanbanchi. A free trial is available.
Google has its Workspace pack that includes a variety of products. Gmail, Docs, and Sheets are the most well-known and notable. But many project managers ask for a Gantt chart solution in Google Workspace. And Workspace lacks it, unfortunately. However, an alternative is very easy to reach. Kanbanchi offers Google users a Gantt chart that works significantly in Google Drive. The bonus is that it's a full project management solution.
Google suggests that Workspace users utilize spreadsheets to create Gantt Charts. Users may even consult the detailed instruction on how to do it. While it may be a workaround for some, most project managers will agree that it is quite annoying and time-consuming to create and support such charts. Also, spreadsheets, at their core, aren't meant for management.
They are good for calculations and information storage. In our current, consistently changing environment, we require more flexible tools. In the meantime, companies on Google Workspace must have synchronization of tools because they store all the data in one place.
Gantt Chart in Kanbanchi
Kanbanchi provides a project management suite that includes a Kanban board, Gantt chart, Time tracker, and other valuable tools for everyday workflow. The app is integrated with most Google apps and works with Google Drive.
The Gantt chart inside the app is enormously easy to use, create, and maintain. You can make changes in one or two clicks and see them on the Kanban board at once. Kanbanchi application supports Google's primary goal - transparency in workflows. All the changes are reflected in real time, and all teammates will be updated instantaneously.
In today's fast-paced business environment, managing multiple projects across different teams and locations can be a daunting task. Whether your company operates globally or locally, ensuring seamless collaboration and efficient project execution is crucial for success. This is where Kanbanchi comes into play—a powerful project management and collaboration tool designed to streamline your workflow, enhance team productivity, and simplify project tracking.
What is Kanbanchi App?
Kanbanchi is more than just a project management app; it's a comprehensive platform that empowers teams to work smarter by managing projects from start to finish. With Kanbanchi, you can create tasks and projects, assign them to colleagues, set deadlines, and communicate effectively about shared work—all in one intuitive tool. Its user-friendly interface makes it easy to organize and track multiple projects simultaneously, ensuring that everyone involved is informed and aligned.
Key Features of Kanbanchi
Kanbanchi helps companies manage remote team collaboration and work with intuitive software to keep everyone informed. It stands out from other project management tools with its unique set of features:
Kanban Boards: Visualize tasks as cards on a board, making it easy to track progress as tasks move from one stage to another. This visual approach simplifies project management, allowing you to see at a glance what your team members are working on.
Gantt Charts: Convert your Kanban board into a Gantt chart with just one click. This feature displays your entire project schedule over time, showing task relationships and chronology. You can adjust schedules by dragging the edges of the bars, ensuring that all changes are reflected on both the Kanban board and Gantt chart.
Time Tracker: Stay on top of deadlines and ensure that projects are completed on time. The Time Tracker helps you monitor how much time is spent on each task, providing valuable insights into project efficiency.
How Can You Use Kanbanchi?
Kanbanchi is accessible via your browser from anywhere in the world, making it perfect for remote teams. Here are some ways to leverage its capabilities:
Organize Tasks: Use Kanbanchi to organize your team's tasks by dragging and dropping them onto a Kanban board. This visual approach ensures clarity and simplicity in project management.
Collaborate Effectively: Communicate with team members directly within the platform. Attach files from OneDrive or Google Drive, and create events in Google Calendar or Outlook, ensuring that everyone is on the same page.
Track Progress: Monitor project progress using both Kanban boards and Gantt charts. Adjust schedules as needed, and use the Time Tracker to ensure timely completion.
Integration with Google or Microsoft ecosystem
Initially, Kanbanchi was explicitly built for the Google ecosystem. To use it, you just needed to sign up with a Google account and connect it to your Google Drive. Later, it was made possible to sign up with a Microsoft account and connect it to OneDrive, too. You can attach Google Docs or Sheets, save your boards as files in Google Drive, create events in Google Calendar, and attach documents from OneDrive in a similar manner.
Takeaway
Kanbanchi is not just a tool; it's a comprehensive solution that ties together project management, collaboration, and efficiency. By providing a structured methodology for organizing work, Kanbanchi helps teams set up projects quickly and stress-free. Whether you're managing a small team or a large enterprise, Kanbanchi's integrated project management capabilities make it an indispensable asset for achieving success in today's fast-paced business world.
In conclusion, Kanbanchi is project management at its best—offering a seamless, intuitive, and powerful way to manage projects and collaborate with your team, whether you're part of the Microsoft or Google ecosystem.
Google Workspace has been developed for corporate clients. It has many useful features. However, it lacks a built-in Kanban board or other dedicated project management tools. Although it has many powerful tools, none are specifically designed for project management. In addition, Google’s search activity (especially the phrase "Does Google have a Kanban board") indicates that most businesses use project management tools rather than just a simple database or spreadsheet to keep track of their projects.
Google Workspace users need a Kanban board and other project management tools integrated with Google products, so it doesn’t feel like you’re using a third-party tool. This will keep users from feeling like they’re leaving their familiar environment. To explore your options, check out our list of the best Kanban project management software tools that integrate seamlessly with Google Workspace.
Kanban Board Integrated Into Google Ecosystem
Many Google Workspace apps offer connections to other Google apps, but few can offer full integration with seamless authorization. Kanbanchi provides an online Kanban board tool built on the Google Cloud Platform and working inside Google Drive.
Moreover, the Kanbanchi app is among the best Kanban board software products in the marketplace. This collaboration product fully integrates with Google Drive, Docs, Sheets, Gmail, Calendar, etc. That’s why it’s the preferred solution for businesses of all sizes. Just sign up with your Google account and start organizing your business.
Project Management App Right Inside Your Google Drive
Kanbanchi is a new way to set up your workflow system. It allows you to manage your projects online, share them with others, and stay on top of progress. You can save and manipulate your boards as files; it's all right in Google Drive. That makes it a perfect match for corporate Google Workspace users.
To learn more about Kanbanchi as a Google Kanban board, please read this article: What is Kanbanchi? - or sign up to start with a free trial right now.
We are deprecating Kanbanchi free tier on 15 October 2019.
Kanbanchi used to be free for personal use. Everyone who used a personal account (e.g. name@gmail.com) to sign in Kanbanchi was granted with free access to Kanbanchi core functionality. However, we have decided to discontinue the free tier for personal use.
Everything will stay the same for the users who signed in before 15 October 2019. They will still be able to use Kanbanchi free version. What’s included in the free version: core kanban functionality – boards & cards, search & filter, real-time changes, email & in-app notifications, comments, activity feed, Google Drive attachments, pushing dates to Google Calendar, export to CSV (only card title and description), board background. There’s no support, but users can consult our FAQ page.
Contact us to find out what domains are regarded as personal in Kanbanchi. Feel free to share your opinion or ask questions.
72. What is a productivity dashboard and how can I use it?
A productivity dashboard is a summary view of your activities measured against the resources spent on those activities. They come in many different forms: tables, charts, pictures. In general, you'd want to have one if you need to know how much time/money/other resources you need to spend to get a particular desired result. This is exactly what productivity is about: spend less, gain more.
Who uses productivity dashboards?
Owners of a business
Executives
Managers
Team leads
Analysts
If you own a business it's crucial for you to know its effectiveness. You might also be interested to compare your employees' productivity. Executives find it useful to have an overview of their project in a single-page form. Managers can learn from a productivity dashboard if there's a need to make any changes to the established processes or not. Team leads will be interested in understanding their team capabilities. And analysts obviously need to know all aspects of a project they are working on.
What does the productivity dashboard look like?
You may use tables or different charts to measure your business or team productivity. Composing them with the data from different sources is time-consuming and sometimes causes errors. However, it's still common to create tables and charts in Excel, for example.
With the spread of online work tools, it's more common to have your productivity dashboards online as well. One of the most widespread work office kits is Google Workspace (G Suite). G Suite users create their productivity dashboards using Google Data Studio. This app can take data from your Google Spreadsheets and create nice visual dashboards out of them.
If you are using many apps to manage your projects it becomes complicated to create your dashboards. You may forget to download data, you may get errors. As a result, you don't have enough reliable data to make important decisions. If that's your case, consider switching to one app that may serve you as the ultimate data source.
Kanbanchi is a task and project management app that is integrated with Google Workspace. Hence you may export all data from Kanbanchi in a form of a Google Spreadsheet and then create your productivity dashboard based on these exports. More than that, Kanbanchi won't only be a data source but will become a productivity dashboard itself.
It's a rare case when someone needs to see just the overview. Seniors and owners do but the majority of employees would need a more detailed view than just what Google Data Studio shows. And Kanbanchi will be their detailed productivity dashboard. Kanbanchi has a built-in Gantt chart that can be used to see the details of a project but still in a form of a single-page compact view, a sort of productivity dashboard but containing more details.
Companies using Kanbanchi as their corporate app for project management reduce their effort for dashboards creation by 45% due to the option of exporting data from their Kanbanchi board to Google Spreadsheet and then using Google Data Studio.
There are so many Trello alternatives so that there's even a term "Trello-like apps". It has a good side as well as the bad one. The good is that you can easily describe the app, chances are people know Trello. The bad side is that you forget to point out particular differences between Trello and other apps. Kanbanchi is not yet another Trello-like app but has its own unique value that's more than just an online Kanban board.
Kanbanchi is built specifically for Google Workspace users and therefore is designed in a way that allows one to master it in just 15 minutes. Also, it's made in a way that it can support not only small teams but also large companies with thousands of employees. Compared to Trello, Kanbanchi feels like a more mature app with a more business-suited interface.
Project management of any complexity
Light-weight task management or complex project management, Kanbanchi has it for you. The unique combination of several tools in one app (Kanban board, Gantt chart, and Time tracker) makes Kanbanchi able to support teams of any size.
Unlike Trello, Kanbanchi has a very easy and transparent application structure. You will have a set of features in your subscription, and won't need to remember which add-ons you have added. Just pay the price and use what you pay for.
Kanbanchi lives and works inside of your Google Drive, all the information will be stored there. It's often a problem for teams extensively using Google Workspace, that their documents and all other important assets are stored in Google Drive and it's not secure to upload them to another project management app just to have quick access from a project board. Kanbanchi eliminates this problem, all your files stay in your Google Drive at the same time connected to project boards.
Another great benefit of the integration is that you will have no other login and password than your Google account. Sign up with your Google account and use it to log in and work.
Other benefits of seamless Google Workspace integration include:
Attaching files from your Drive/Shared Drives to Kanbanchi boards in just a second;
Adding tasks to your Google calendar and any Google calendar that you have access to;
Having similar familiar and intuitive interface;
Converting emails to tasks from within your Gmail (including mobile Gmail);
Creating tasks from Google Forms;
Inheriting access permissions from your Drive settings the same way it works for all other files in your Google Drive;
Exporting boards data to Google Spreadsheets. Later you may use them for various purposes;
Creating custom reports out of exported Spreadsheets using Google Data Studio.
Learn more about Kanbanchi as a project management tool inside Google Workspace
Let your team grow, no need to change tools
Any business intends to evolve and grow. When your team grows you will come to the point when you need to equip your team with more powerful tools to perform better. It's very common for small teams to start with cheaper task management apps, like Trello, because small business is very price sensitive. However, when they grow they need more powerful solutions and have to either use several tools or migrate to another app. It takes much time and effort and often results in a significant drop in productivity.
Kanbanchi team has been there, that's why we know the way out. Small teams can start with a cheaper subscription that has all features they might need at their start. When growing, teams may upgrade to add more powerful tools in the same familiar app. Ready to try Kanbanchi? You may start with it right away!
74. What is the best online team collaboration software?
Today’s companies are increasingly becoming more agile. This new economic environment is focused on the sharing of information, resources, and ideas to create sustainable partnerships that require agility and flexibility. A fast-paced, global and dynamic business environment requires companies to be more adaptable, flexible, and collaborative as they develop new products and services. To do this effectively, organizations need to increase their collaboration capabilities to enable continuous performance improvement and new business opportunities.
In the modern world, it’s no longer enough to just produce quality work - successful teams must also be able to work well together. That’s why collaboration software becomes increasingly an important part of successful business strategy. Having the best collaboration software can ensure communication is fast, clear and can improve efficiency and increased productivity within your company.
What is collaboration software?
Collaboration software is the operating system that keeps remote teams working together. It helps you connect with your team and their projects easily and effectively. In today’s workplace people are increasingly starting to work remotely, not only from home or outside the company office, but also from various different countries. And collaboration apps are critical for communication and teamwork across physical and cultural boundaries.
When you’re looking for the best collaboration software, you’ll want something that makes it simple and easy to collaborate with your team online. You want to be able to share files and manage projects with your team in real-time. That way, everyone can work together and move projects forward – regardless of where they are or what time zone they operate in.
What is the best online team collaboration software?
When it comes to online collaboration, there are a number of different platforms for businesses to choose from. The collaboration software market is offering a lot of solutions making it easy for your business to make the right choice for the best price. Online collaboration software products need to be selected based on their overall functionality, design, ease-of-use, popularity, and whether they have a free option, and it’s no surprise that Kanbanchi meets all these requirements and is called one of the best.
Kanbanchi is one of the most popular online team collaboration software, which can be integrated into Google Workplace. It is very easy to use for everyone - from beginners to experienced tech employees. It has awesome features like Kanban Board, Gantt Chart, and Time Tracker. It helps you to collaborate with your team as one and easily manage your ongoing projects using boards and cards. You and your teammates can create and share an unlimited number of boards and cards, share them, attach files from Google Drive and Shared Drive, easily sort and filter cards and leave comments. All changes that the team makes are reflected in real-time and you can see who is working on the specific task board at the moment. This helps to distribute tasks smartly and to evaluate the team’s results.
If your team chooses Kanbanchi as collaboration software, jumping into action should be a no-brainer. Once your team starts using the app, you’ll realize the potential of how much more efficient you can be when working together.
Whether you are running a startup or a multinational company, the core values of teamwork remain the same. Without cohesive communication, mutual trust, and clear accountability, any team collaboration can fall apart.
Technology has empowered teams with various team collaboration software to address specific challenges of teamwork.
Meet team collaboration software
Team collaboration software should meet the following criteria:
It’s not specific to any industry or niche.
It’s easy on the pocket.
User-friendly and intuitive.
Provides the ability to allocate tasks and monitor team members' workloads.
Has effortless integrations with email, scheduling, and file storage services.
Google Workplace is one of the collaboration packs for teams. It is a collection of productivity, collaboration, and other utility tools developed by Google Cloud. Some of its popular tools are Gmail, Meet, Calendar, Docs, Sheets, Slides, and Sites. Almost every team collaborates on various documents, spreadsheets, slides, and other materials. But it turns out that Google Workspace lacks a task management/project management tool.
Team collaboration software integrated with Google
Kanbanchi can help here. It is some kind of "Google team collaboration software" for task management, integrated with Google Workspace. Firstly, Kanbanchi is easy to use, and even non-tech-savvy individuals quickly get on board. Secondly, the tool contains essential collaborative features. For instance, all the changes are reflected in real-time. You know who exactly is collaborating on the board right now and on which specific task. The Kanbanchi team workload monitoring tool helps distribute tasks efficiently. While reports help the team evaluate the results. Above all, it integrates with Gmail, Google Calendar, and Google Drive, which makes Kanbanchi a perfect solution for teams on Google Workspace.
Henry Gantt invented the Gantt chart at the beginning of the XX century. More than 100 years later his invention is still considered to be one of the most important tools for project planning and scheduling.
Generally speaking, the Gantt chart is a graphical representation of the workflow schedule. Its main aim is to track the timeline and check whether the project meets deadlines. Also, the tool helps to keep the task implementation sequence under control. Commonly project managers in companies of all sizes use business Gantt charts. However, the Gantt chart can prove beneficial to various businesses and teams.
For example, Enterprise companies rely on the Gantt chart to schedule activities far ahead. Small teams may use the business Gantt chart to depict the tasks for the upcoming months. Both may utilize the chart to share the strategy with the stakeholders or external clients.
The way the Gantt chart represents the information is really easy to understand. It shows the list of tasks on the vertical axis. The horizontal axis shows the timeline. Tasks are depicted as bars on the chart. Depending on the width of a bar you can observe the duration of the task.
A proper Gantt chart shows task properties as well. For instance, it's progress, status and relations with the other tasks.
Kanbanchi Gantt chart
Digital Gantt chart brings more convenience to task tracking. You only need to choose the right tool. Let's review how to build the Gantt chart in the project management tool Kanbanchi.
The kanban view of Kanbanchi shows tasks in lists. Cards represent tasks. Kanbanchi has a very convenient setting that allows representing all the cards from the Kanban view on the Gantt chart. Please navigate to the board setting and activate the "All cards on Gantt chart" option to turn it on.
Once it is activated, start creating tasks on the board. Tasks will automatically appear on the chart.
Let's build the chart!
Since the Gantt chart shows the tasks in a timeline you obviously need to set start and due dates for the tasks. Observe how the bars appear on the chart.
If you use subcards you will see the epic cards and their subcards in groups when switching to the Gantt chart. Additionally, it will be easy to distinguish epic cards from subcards as they are displayed differently on the chart. Epic cards are shown with the yellow crown icon in the list of tasks. On the chart, the epic card also differs from an ordinary card.
You may colour code cards to bring more visibility to the chart and see critical tasks or those that belong to a specific department. Moreover, the Kanbanchi Gantt chart displays task statuses.
Certainly, the task panel is customizable and you may choose what specific properties you'd like to observe. Need to focus on the chart? Collapse the task list completely.
Kanbanchi Gantt chart is a convenient tool for business and it doesn't take much time to build it. Moreover, if you need to reschedule the items you don't have to do it manually. Drag and drop the edge of a bar or the whole bar to change the dates for a task.
Task dependencies
Usually, task dependencies are set to display in which specific sequence the task should be fulfilled. There are four types of dependencies you may set:
Start to start
Start to finish
Finish to start
Finish to finish
On the Gantt chart, you will see these dependencies in black arrows. But if the dependency is broken, the arrow will be red.
Milestones
Milestones are used to mark specific points on a project timeline, e.g. date of review or release date. You may mark a card as a milestone and it will appear on the Gantt chart as a diamond.
It's that easy!
We've just created the Gantt chart in Kanbanchi together. Nothing to it, right? We are sure you will definitely cope with building the Gantt chart for your workflow with the help of Kanbanchi.
Among Jira alternatives, Kanbanchi is built for cross-department collaboration, while Jira is tuned specifically for technical and development teams. Are they so very different? And which app is more flexible?
At its core, Jira has been designed to help to build software or fix bugs and issues. In many companies, ordinary people say it's not flexible enough for all teams, and not intuitive enough to pick up and start using it quickly. However, Jira is on the market for a long time and has great visibility. At the same time, people from IT departments in many companies are the ones who choose apps for all teams. So, the situation of choosing Jira just because it's something that IT uses is very common. Would you prefer using the app that suits everyone in your company or the one that's chosen by just one department?
Kanbanchi can support any software development or product team. At its early stage back in 2012-2013, Kanbanchi was an internal project of a development company Magic Web Solutions. It was born out of the team's need for a task and project management app connected with Google Workspace (Google Apps for work back then). During the almost 10-year history of Kanbanchi, the app evolved from just a product roadmap and issue tracker into a versatile project management application that supports all types of teams in a company.
Whether it's a tech-savvy IT person or junior staff that just needs to have their daily to-do list, Kanbanchi has it for you. Kanban board for teams supporting agile methodology, Gantt chart for top managers focused on company's strategic goals, List view for those who work hard every day to achieve those goals and much more to help build a smooth connection between them.
Get better cohesion between your Google Workspace and a project management app
Kanbanchi is part of your Google Drive, it lives and works there. All you need to log in is your Google account, no more logins, and passwords that you have to remember. Seamless integration makes Kanbanchi very reliable and secure because you store information inside your company's Google Drive.
Among numerous benefits of tight integration with Google Workspace are:
Attaching files from your Drive/Shared Drives to Kanbanchi boards in just a second;
Adding tasks to your Google calendar and any Google calendar that you have access to;
Having similar familiar and intuitive interface;
Converting emails to tasks from within your Gmail (including mobile Gmail);
Creating tasks from Google Forms;
Inheriting access permissions from your Drive settings the same way it works for all other files in your Google Drive;
Exporting boards data to Google Spreadsheets. Later you may use them for various purposes;
Creating custom reports out of exported Spreadsheets using Google Data Studio.
Learn more about Kanbanchi as a project management tool inside Google Workspace
Give your team a chance to start working faster
For Jira, you need to have an administrator that will set up boards for projects. This administrator installs and deploys the tool, applies settings and rules. Later you will need them to keep an eye on your Jira and provide help to users.
Kanbanchi is easy and intuitive enough so that everyone may master it in 15-20 minutes and start collaborating with colleagues. Everyone may create a board and have it just for themselves or share it with team members. Boards do not necessarily need to have the same settings. We understand that all projects are different, therefore it's not possible to find a magic "fits-them-all" formula and create all boards with the same settings.
You need to control a huge number of activities and make sure that they're going to be completed as planned to finish a project on time. Missing one deadline can delay the entire project and increase its cost. That's why the Gantt chart application is used, giving an opportunity to see what and when needs to be done.
A Gantt chart is a graphical display of your project's schedule. It is a kind of chart showing start and due dates for all project elements and includes tasks, milestones, and dependencies. A properly created Gantt chart is sure to simplify any project planning process. And if the Gantt Chart application is a part of the combined tool, like Kanbanchi, where you can observe both Kanban and Gantt Chart, it’s a blast!
Let's see how the Gantt chart in Kanbanchi can help you to organize a workflow.
Step 1: First of all, you need to think over the whole project and divide it into manageable tasks. Then, set up a card for each task and assign the cards to your teammates. Don't forget to add Start and Due dates to each card.
Step 2: It’s time to distinguish task relationships and distribute dependencies between the tasks.
You may set a card as an Epic adding or creating Subcards. It will calculate the Epic's progress automatically.
You can also link cards through a simple finish-to-start Dependency. Dependencies help to make connections between tasks more visual and the whole project more manageable.
And the last thing - display Milestones to show key events.
Your Gantt chart may look like this
Step 3: Enjoy completing the project with your well-organized Gantt chart! As the project moves on, update your chart to reflect all the changes both on the Gantt chart and on Kanban. This will help you to keep your plans and your team up to date.
Google Workspace features were designed to help us all work together more easily. Google ecosystem combines a range of cloud computing, collaboration, and productivity tools. Deep integration of all the apps allows you, as a user, to create new documents or make calls wherever you are and whatever you are working on. Сertainly it saves your time on the tasks that you have to carry out every single day. We can show you how it works by looking at the key components that you will probably get the most benefit from.
Google Workspace Features People Use in Their Daily Routine
Gmail. Most customers choose to communicate with businesses by email. Google Workspaces allows you to use an email address with your company name, thus helping you to look more professional. So that customers take your messages more seriously. It should also mean that more emails will get to the recipients instead of ending up in the recipients´ spam folders.
Google Calendar should also become a big part of your working day if you want to be more organized. It is perfect for scheduling tasks, putting in due dates, and setting up reminders. You can even create separate calendars for various events, giving access to everyone in the team who needs to see them.
Google Drive lets you securely store your files and easily access and share them from any device. The search function for this Google Workspace feature gives you an opportunity to search based on the content of the documents, not only just the file name.
Google Docs and Google Sheets allow you to create and edit text documents and spreadsheets directly in your browser. You can also very easily import documents and instantly edit them. What's more, you can collaborate very simply with people even if they use other formats.
Google Meet and Chat let you communicate with others both on a one-to-one and a group basis. Due to full integration, you can accept invitations from your calendar and email as well.
Mobile compatibility ensures that you will access Google Workspace features from any device. At the same time, mobile management allows you to remotely remove all your data from any lost or compromised device.
Admin Console gives the business owners an opportunity to manage everything, from adding new users to managing devices and configuring security settings.
Google Workspace Marketplace lets you find thousands of useful add-ons and apps, sure to help you work more efficiently, whatever type of business you have. Lots of people look there for a project management tool, as Google Workspace has no special tool for it yet. In case you also do, we advise you to pay attention to Kanbanchi.
Why Kanbanchi?
Kanbanchi is an easy-to-start and use project management app with a familiar Google-like interface. It contains an online Kanban board that integrates with your Google Drive and Google Calendar, making it perfect for managing projects. You can attach any Google file to a Kanbanchi card and use a variety of other time-saving features.
Sure, Google Workspace is a great solution for any type of business when it comes to daily tasks like document storage, email management, and team collaboration. But it is incredibly effective when used with a project management tool like Kanbanchi. Add Kanbanchi to your Google Workspace, and you'll easily move your business forward.
Nowadays, people are overwhelmed and often have to perform many different tasks both at work and in their personal lives. A long time ago, in order not to forget anything, people began to use a daily planner. However, in today's world with frequent changes in tasks and deadlines, paper daily planners no longer cope with their tasks or require too much time to keep up to date. They also cannot remind you of a task if you do not open them yourself. Obviously, the digital age requires digital solutions to this problem.
Google Workspace is one of the very popular tools that individuals and companies use; it has a lot of features, but does Google have a daily planner?
What Should a Digital Daily Planner Actually Do?
At minimum, it should let you create tasks quickly, set priorities and deadlines, organize work by category or project, send reminders, and give you a clear view of what needs attention today versus what can wait. The best tools also allow collaboration, because today, few of us plan in isolation. Work tasks involve teammates, clients, and deadlines that affect other people's schedules. A planner that works only for you personally quickly hits a ceiling.
Nowadays, Google services are very popular. So especially now, after the pandemic, work tasks and documents come through Gmail more and more often. The number of Gmail users has increased significantly. People also use Google Calendar and other Google services more often, which can partially cover the need for a daily planner. However, a full-fledged Google daily planner still does not exist. Therefore, Google users apply third-party tools that can cope with the functions that a Google daily planner should have. You may have even tried some of them. Google does offer some tools that come close.
Google Tasks lets you create simple to-do lists connected to Gmail and Calendar.
Google Calendar helps you schedule time blocks and set reminders.
For basic personal planning, combining these two can work reasonably well. But they do not integrate into a unified planning view; they are not designed for project-level planning with multiple people, and they lack features like Kanban boards, Gantt timelines, time tracking, and workload management. Individual reminders are fine. For managing actual work with projects, priorities, and team dependencies, they quickly reach their limit.
Why Kanbanchi is Perfect for Planning?
The advantage of Kanbanchi is that the application was developed with maximum integration into the Google Workspace ecosystem. A familiar Google-like interface makes it much easier for Google users to start working with the application. In addition, Kanbanchi is not just a daily planner, but a great project management tool with an impressive set of features.
It has several views, including Kanban view, List view, Team Workload view, and of course, a Gantt chart. You can also use a Time tracker, various Reports, an Archive, and other useful features for everyday workflow. With the Kanbanchi for Gmail add-on, you can even create cards directly from your Gmail. Kanbanchi is sure to make your everyday life and work easier.
How to Use Kanbanchi as Your Daily Planner
Starting is simple. Open your Kanbanchi board at the beginning of each day and review the cards assigned to you. Cards due today are easy to filter, so you always know what requires immediate attention without scrolling through everything on the board.
As tasks come in through Gmail, the Gmail add-on lets you turn them into cards instantly: no copying, no switching between apps. A client email becomes a task with an owner, a due date, and an attached file in seconds.
For planning further ahead, the Gantt chart gives you a timeline view of everything on your plate across days, weeks, or months. Grouping by user (Team Workload view) shows whether your schedule is already full before you commit to more. And when priorities shift (as they always do), you simply move or update the card. No rewriting, no new page, no starting fresh.
We advise you not to waste time looking through different applications and try Kanbanchi right away.
81. What are the most common collaboration challenges?
Since so much time is spent collaborating with others, it’s no longer enough to just be a team player. It’s necessary to take and overcome collaboration challenges:
Physical proximity
Conflicts in the way we work
Engagement and responsibility
Proving trust
Communication, offline and online
1. Physical proximity
It’s not a surprise that technology is changing the way modern employees interact. From enabling us to work from nearly anywhere on any device to enhance the way we communicate and collaborate, the opportunities to increase productivity via innovative technology is growing every day.
Teams work better together when members are in close physical proximity. While remote work is physically possible, it’s not always the optimal way for teams to engage. If team members mostly work remotely, it’s good to have periodic in-person team meetings.
2. Conflicts in the way we work
No two people are the same. When different processes, ideologies and goals clash, conflicts arise. If teams don’t get how to work together or why they need to collaborate, success is an unlikely outcome.
Team members must communicate to clarify what everyone should be doing in their role so they’re all on the same page.
3. Engagement and responsibility
A lack of defined responsibilities leads to a refusal to collaborate with individual team members. Team members need to understand each other’s roles to share ideas. When team members make unique contributions toward a common goal, they should receive equal credit for the outcome.
4. Proving trust
Trust is fundamental to collaboration. Building trust is easier said than done in most cases. Sometimes, employees make mistakes and it can be hard for you or other team members to trust them with any other decisions.
It’s critical to develop strong connections with those around you. Trust is quickly established if you prioritize clear boundaries and expectations.
5. Communication, offline and online
In recent years, many organizations have turned to remote teams as a means of connecting and engaging with employees across the globe. Managing teams of this sort present many, sometimes unique, challenges.
Collaboration is now coupled with technology. So many people stay in contact through different channels every day. Managers today spend up to 85% of their time on collaborative tools. Instead of discussing everything in the meetings and taking notes, a collaborative tool, such as Kanbanchi may be used. It helps to set up the workflow in a team, create tasks, collaborate with colleagues. Moreover, Kanbanchi is integrated with Google Apps, which makes daily working processes even easier.
Agile planning is a popular project planning method that divides work into sprints - self-contained work iterations. Sprints usually take quite short periods of time, about 1-2 weeks. During this time a team focuses on a small number of work items and strives to complete all of them. Agile planning identifies the items that should be done in each sprint and builds a repeatable process, to bring teams to an understanding of what they can accomplish.
Everything looks pretty simple if the project is not big. The requirements and ideas for your project, also called Backlogs may come from all stakeholders like the Business and Product Owners, customers, and of course your team members. Some of the requirements might be light enhancements or functional additions to the product. So that they can be completed during a sprint. But quite often a Backlog is larger and impossible to fit into an iteration. Such Backlogs named User Stories and split into two or more sprints. They say that the right User Story should be small enough to fit into one 'Sticky Note'. Larger backlog items are treated as features delivering business value to customers. Further, you should also break these features down into stories and then schedule the stories over multiple iterations.
The bigger the businesses the more product portfolios they will have. There may be large-scale requirements or initiatives, such as the very idea of a new product, that may involve multiple teams and iterations. But how to deal with huge initiatives that span multiple iterations? To handle such large-scale developments Agile suggests the following 5 levels of planning.
1.Product vision
Product vision is the long-term result that the product strives for. The vision should be clear enough to explain what an organization or product should look like after the project finishes and what efforts can be used to achieve this goal. Further planning activities will detail the vision, and may even alter it as the future might change market perspectives, the product, or the efforts required to make the vision reality. Anyway, all teams and team members will coordinate their work to ensure that this ultimate goal is achieved.
2. Roadmap
The roadmap is a product development plan to achieve the above vision. You can do it through graphical representation of the releases, or more formally in a written document. Your roadmap should clearly outline a plan with milestones, identifying steps that will help your business move closer to the goal.
3. Release plan
The release plan defines the list of features that will be implemented at a certain time. In small projects, the product backlog alone can provide a sufficient overview of the project. The size, duration, and results are easy to recognize and there is no need to synchronize or group aimed results. But for big and split to several teams projects, it is necessary to group activities and assign them to teams during release planning.
4. Iteration plan
You will need a planning session for each sprint within the release to add details and improve accuracy. During the session, break functions into tasks and calculate the real-time necessary for each task. It will help the team deliver a range of features with a high degree of confidence during the iteration.
5. Daily stand-up
The stand-up meeting is a part of everyday life for agile project management. These daily meetings are not often seen as planning sessions, but they certainly are. At such meetings, each team member should share details about: "what was done yesterday", "what are the plans for today" and "any obstacles/problems currently being faced" if there are some. Daily meetings are crucial to communicating progress, identifying and solving issues during a sprint.
For small products, the Iteration Planning and Daily Standup levels might be enough. Therefore, depending on the size of the requirements in Backlog, you can apply just several or all of the planning levels as required.
Using a team management tool can be a big help for agile planning. Try Kanbanchi and it will help you define the user stories in each release and organize the stories into sprints. In Kanbanchi you can also assign tasks to different team members and easily track the progress. Kanbanchi will help you and your team unite your processes and focus on what really matters — getting work done in time.
Productive teamwork always goes hand in hand with synergy. The teams that work as a single entity demonstrate higher results and achieve goals easier. The best team collaboration software helps people stay on the same page and cooperate successfully.
What are the best collaboration tools for teamwork?
The question "How can collaboration tools help me?" might naturally arise. Certainly, it might be hard to gather a dream team. Actually, companies often don't have enough time and resources for that. As a result, collaborators might not be on the same wavelength. However, they still have to gel with each other. The right collaborative software helps to speed up and ease this not always a pleasant process.
To make the right choice it is important to keep in mind the requirements the best collaboration tool needs to comply with. In other words, the tool should have collaboration as the core aspect. As a result, the decision-maker should pay special attention to the following checklist:
User-friendly and intuitive interface;
Real-time changes and indicators for users who are present in the app;
Ability to allocate tasks and monitor the workload of team members;
Effortless integrations with email, scheduling and file storage services;
Configurable in-app or email notifications;
Activity log and backups.
What are examples of collaboration software?
Kanbanchi users are sure that it is the best team collaboration software. Well, it is no wonder.
Firstly, Kanbanchi is easy to use, and even non-tech heads quickly get on board. Secondly, the tool contains essential collaborative features. For instance, all the changes are reflected in real-time. It is obvious who exactly is collaborating on the board right now and on which specific task. The team workload monitoring tool of Kanbanchi helps to distribute tasks smartly. While reports help the team evaluate the results. Above all, it is integrated with Gmail, Google Calendar and Google Drive which makes Kanbanchi a perfect solution for teams on Google Workspace.
Previously, Kanbanchi subscriptions were formed around features. While this structure seemed flexible at the first sight, it had its own shortcomings. The number of features was constantly increasing, and it started to take more and more users’ time to explore all available them, decide which of them might be useful, learn about pricing and, finally, purchase subscriptions. That caused certain confusion among users, and increased the time of their interaction with our sales team.
For that and other reasons, we have consolidated multiple feature-based subscriptions to 2 coherent subscription plans – Premium and Professional. The features of our legacy subscriptions we’ve recorded below:
All Paid Features: Gantt Chart, Time Tracker, Company’s Logo, Card from email, Export to Google Sheets, Sorting cards by priority, Dashboard Backups, List View and Subcards.
Gantt Chart: Gantt Chart, Card from email, Export to Google Sheets, Sorting cards by priority, Dashboard Backups, List View, Subcards and Shared Drive Integration included.
Time Tracker: Time Tracker, Card from email, Export to Google Sheets, Sorting cards by priority, Dashboard Backups, List View, Subcards and Shared Drive Integration included.
Company's Logo: Company’s Logo, Card from email, Export to Google Sheets, Sorting cards by priority, Dashboard Backups, List View, Subcards and Shared Drive Integration included.
Will you continue to support the legacy subscriptions?
How are new subscriptions better than previous ones?
New Kanbanchi plans are called Premium and Professional. Premium is ideal for companies or teams, who only need a shared space for Task Management and Team Collaboration. Professional is the best choice for companies and teams, who need more sophisticated functionality for professional Project Management and Time Tracking.
85. Does Google Workspace have a collaboration app?
Google Workspace is no doubt one of the power packs of apps for companies. Meanwhile, it doesn’t include any Google Workspace collaboration app. So, here come the smaller yet no less great solutions, like Kanbanchi.
Specifically designed for Google Workspace users, Kanbanchi provides users with the project management and task management collaboration app within the familiar Google ecosystem.
There’s a great demand for a collaboration tool integrated with Google Workspace if we analyse the search level for “google workspace collaboration app”.
Do people search for a concrete collaboration app?
The main point is to find a tool that operates the same way as Google Workspace. Kanbanchi works in Google Drive and acts exactly like any other file that you put inside your Drive. You can create boards for your projects and then open and share them from your Drive as well as from within the app.
Project managers working in businesses that use Google Workspace request to have a collaboration software that supports a kanban board and Gantt chart. Also, they would like to continue using the pros of Google Workspace, so they need to share Google Docs and Sheets, collaborate with their teams editing these docs, attach files from Google Drive and synchronize tasks with Google Calendar.
Do these requests sound familiar to you?
Then, Kanbanchi is what you really need! It has all these features in one pack with real-time synchronization. It makes collaboration smooth and transparent so that Kanbanchi will soon become a mandatory part of your everyday workflow.
Want to try the power of Kanbanchi and Google Workspace?
Productivity software was worked out to provide a stress-free work experience for individuals and companies. It should help them follow through with their daily tasks efficiently. Modern productivity applications combine project and task management, task calendar, file sharing, and other features. It is crucial now as many companies continue to work remotely.
Before taking advantage of using the productivity software, you need to find the right PM tool for your team and also learn how to set it up.
Here are the key features of a productivity application we advise that you pay attention to:
the app should be intuitive and easy enough to be used on a daily basis. So that all the team members could enjoy using the application instead of hating it;
organized Kanban boards and other views of your projects;
the opportunity to view a project by timeline, across the whole team;
recurring tasks give you an opportunity to set ongoing monthly, weekly, or daily tasks according to the requirements of your workflow;
the ability to create tasks by email saves a lot of time;
single sign-on with Google or Microsoft accounts simplifies the set-up of a productivity application profile.
Try Kanbanchi to get all the listed key features in one productivity application. It has Google sign-on and works with Google Drive. Kanbanchi provides a great project management suite including Kanban board, List view, Gantt chart, and a Team Workload view. Moreover, it includes an archive, various reports, a Time tracker, and other useful tools for everyday workflow. The app has Kanbanchi for Gmail add-on to create cards directly from Gmail. So it helps you do more with less effort. Kanbanchi app's set-up takes less than 5 minutes: sign in with a Google account, create a board, add tasks, share with colleagues.
It is common knowledge that Kanban is good for project management. However, there are also a fairly large number of Scrum supporters. Let's take a look at both of these methodologies and try to determine which one in the Kanban vs Scrum debate is better.
What do we know about these methods?
Let's talk about Scrum first. Scrum methodology appeared in the mid-1980s, and become the main incarnation of agile methodology since 2001. This year Ken Schwaber and Mike Beedle published the book on it named: Agile Software Development with Scrum.
The main idea behind Scrum is to define a clear work structure built of sprints. Sprints are tasks of short duration. Such a work structure makes the whole project more adaptive and flexible. Short, nearly two-week-long cycles are managed by a scrum master who should guide the team. It can be done through daily scrum meetings, supporting the team members, and giving them the right direction. Most often Scrum is used by smaller teams.
Kanban methodology was developed in the Toyota car company factories in Japan. It’s a simple visual way to manage your workflow. The word Kanban in Japanese means a billboard. It was taken as the method involves placing and moving cards on a Kanban board. These cards represent different project aspects and tasks. Work is usually organized with the help of several columns for example "To do" "Doing" and "Done". Such a board makes the project’s progress clear and transparent for all the involved. With Kanban, it is also much easier to see planning flaws in time and reorganize everything before it resulted in slack.
So at first glance, both methodologies look pretty similar. For example, both are focused on delivering fast and like to break a project into smaller, more manageable parts. Their transparent culture helps with improving the process. Both limit the amount of work in progress and imply a continuous flow of planning instead of progressing on a schedule. This makes them ideal for lean and agile projects. On the other hand, they also have enough differences.
Scrum Advantages and Weak Points.
As Scrum is more structured it is a better fit for projects requiring more specific procedures and roles. Its framework becomes an important advantage here.
One more Scrum advantage is the increase of team accountability. As you’re moving quickly and meet often, it's, naturally, adds to the project transparency. So it is easier for the scrum master to control everything. That keeps all team members more accountable for their work.
Divided into small pieces Scrum projects can easily accommodate change. The scrum method was designed to stay as a nimbler process able to pivot whenever that is called for.
However, Scrum also has its weak points. First of all, it is the scrum master and the team. The master needs knowledge and experience to get a scrum working. The team also requires a bit of experience. Otherwise, the results will be disastrous.
Secondly, daily scrum meetings might become a problem for a team, especially in cases when there are remote team members or the team is quite large. Keeping meetings over a webcam or with dozens of people efficient can be pretty hard. That is why Scrum is more suitable for small, local teams. This might be key in the Kanban vs Scrum debate, as using kanban you will not face any team size limitations.
Why Kanban might be Better
One of the Kanban advantages is that it doesn’t require the experience and training that Scrum demand. Kanban methodology is easy for learning and understanding. It is a big point that you can start at once.
Kanban is sure to
improve your workflow;
reduce waste from the project;
increase the team accountability;
minimize the time cycle of the project;
increase the process flexibility;
As a Kanban board doesn't have required time boxes and sprints, you don’t need to reset the board while you are moving through the project. You can use it as long as the project needs it to.
Unfortunately, Kanban is not ideal in all as well. For example, the advantage of not having a timeframe can also become a disadvantage in some cases. Without a hard deadline, it’s quite likely that a phase or task will take longer than it should.
Conclusion
We've covered both methodologists, compared Kanban vs Scrum and now it's time to make a choice which one is better. But the point is that it is impossible to choose the best suitable for everyone and always. The better choice will depend upon your project and the nature of your organization. So it is up to you to decide which method Scrum or Kanban is the best for the demands and requirements of both your project and team.
No matter which path you take, Kanban or Scrum, you will need the right tool to help you get the job done. Have a look at Kanbanchi. Kanbanchi is not only a Kanban board that you can use for your Scrum projects as well. It is an agile project manager tool fully integrated with Google Workspace. That's why with Kanbanchi you can also benefit from using such advanced features as Gantt chart, Archive, Time tracker, several types of Reports, and some others.
88. What is the easiest project management software?
Adopting a new software we always expect it to serve as a "magic pill" and contribute to building a flawless workflow. Unfortunately in fact some solutions only cause headaches if it is hard to understand how to use them. Let's figure out what the easiest project management software is and what criteria it meets.
What is an easy project management solution?
Clearly, project management can be challenging. You need to plan the whole workflow, manage resources, set realistic estimates and deadlines. And much more. All this along with the importance to meet stakeholders expectations. Certainly, a trusty assistant represented by an online tool should be easy to use. It means that a solution is intuitive and requires little or no training. Spending productive hours on figuring out how the tool works is definitely not what any user wants. A simple yet powerful project management application is the right thing.
How to make the right choice?
Firstly, the decision-making process may vary across companies and teams. Therefore, on the one hand, a specific employee or a team may find a solution. So they present it to the administrative department. On the other hand, the IT department approves a specific solution and obliges teams to use it. Indeed, no matter who evaluates and makes the decision, they should keep in mind the questions below.
Who will primarily use the tool? Let's face it: it is a common situation when only one team member uses a wide range of features constantly. While the others simply check what should be done.
Are the skills of all collaborators equal? Some of them probably are less experienced and won't cope with complex software.
What features should the easiest project management software have?
Effortless sign-up process. Complicated registration with numerous steps is discouraging. Quick authentication with Google/Outlook account usually is the best possible option.
Easy onboarding. It should be obvious how to get started. Successful onboarding helps the whole team stay engaged and be willing to use the product.
Intuitive interface. Above all, the software should work the way you expect it to. No wandering around looking for a button or switcher!
Flexibility. That's great when there are templates to use. But if a specific structure is obligatory, it can influence the workflow negatively.
Helpful support team. Most importantly, a friendly team should stand behind the scenes. So even if a team faces difficulties, there will be someone to lend a hand.
Taking into consideration all the aforementioned criteria, Kanbanchi might be the best solution. A closer look at Kanbanchi reviews on such platforms as Capterra and G2Crowd reveals that ease of use is what people value in Kanbanchi.
Although Kanbanchi is an easy project management tool it contains such powerful features as the Gantt chart, reports, time tracker, team workload monitoring tool and much more. It integrates Google Workspace services perfectly. Even if a company doesn't utilize Google Workspace, the app can be still used with a personal Gmail account. Try Kanbanchi and see how easy and powerful the app is.
A Gantt chart is simple when you know how to set it up. Gantt Chart is a graphical display of your project's workflow. It shows start and due dates for all project elements and includes tasks, milestones and dependencies. A nicely organized Gantt can simplify any project planning process.
Let's see how you can create a nice Gantt and organize your projects with Kanbanchi, task management and project management tool integrated with Google Workspace.
Step 1. Gantt diagram setup
First of all, think over the whole project and divide it into manageable tasks. Then set up a card for each task, assign the cards to your colleagues. Don't forget to add Start and Due dates to each card and check the Show on Gantt option. The cards may be shown automatically on Gantt Chart if you set this option in the Board settings.
Step 2. Task relations and dependencies
Distinguish task relationships and distribute dependencies between the cards:
Set Epic adding or creating Subcards. It will let you track the Epics’ progress;
Link cards through a simple Finish-To-Start Dependency using the Dependencies feature. It will show that the first card needs to be finished before the second card might start. Dependencies help to make connections between tasks more visual and the whole project – more manageable;
Display Milestones to show key events.
Step 3. Gantt diagram update
As the project moves on, update your chart to reflect the progress. It will help you to keep you and your team updated. Enjoy completing the project with your neat Gantt chart!
To complete a project on time, you need to control a huge number of activities and make sure that they're going to be completed as planned. Missing one deadline can delay the entire project and increase its cost. That's why Gantt charts giving an opportunity to see what and when need to be done at a glance are so helpful.
A Gantt chart is a graphical display of your project's schedule. It is a kind of bar chart showing start and due dates for all project elements and includes tasks, milestones, and dependencies. A properly created Gantt chart is sure to simplify any project planning process.
Let's see how Kanbanchi can help you to create a nice Gantt chart and organize your projects.
Step 1: To create a proper chart first of all you need to think over the whole project and divide it into manageable tasks. Then set up a card for each task and assign the cards to your team members. Don't forget to add Start and Due dates to each card and check the Show on Gantt option in the "actions" section.
Step 2: Now it is time to distinguish task relationships and distribute dependencies between the cards/tasks.
You may make a card an Epic adding or creating Subcards. It will let you calculate the Epics progress.
You can also link cards through a simple Finish-To-Start Dependency using our Dependencies feature. It will show that the first card needs to be finished before the second card might start. Dependencies help to make connections between tasks more visual and the whole projects – more manageable.
And the last thing - display Milestones to show key events.
Now your Gantt chart may look something close to this one
Step 3: Enjoy completing the project with your neat Gantt chart! As the project moves along update your chart to reflect all the changes and the progress. This will help you to keep your plans and your team up to date.
Remote team collaboration software allows you to edit, store, and share documents with your teammates, especially those who are working remotely. Instead of sending files back and forth, collaboration software allows you to work together on the same document in real-time, unlike the standard office experience.
Here Google dominates the market of online collaboration suites. Google Workspace is the most feature-complete tool available, including Google apps that meet the everyday needs of any team. The killer feature for Google Drive is definitely the files’ conversion. You just upload all your current documents into your Drive, share them with your team, and that’s it.
Video Conferencing Tools
Video conferencing apps give the feeling of working in the same space and sitting in the same room. They are also a great way to get a feeling for the team’s mood and engagement of your remote colleagues. Google Meet among conferencing apps, for example, is easy to use and loved by millions of remote working folks.
Remote Project Management Tools and Task Management tools
Though most people prefer to work from home, managing remote teams still meets some challenges. In theory, remote work should be as simple as re-locating your work to a home laptop. But in reality, home environments can present some adversities when it comes to workers managing themselves and in turn, your capacity to manage your remote team. It turns out to minimize your productivity. Here remote project management and task management tools can help.
These tools will help you manage the productivity of your remote team, including time tracking and assign tasks to all team members. And that’s just the tip of the iceberg - we haven’t mentioned notifications and integrated Gantt charts. Tools like Kanbanchi can help you streamline the whole remote team’s working process, track progress and boost productivity in a short period of time. Moreover, with Kanbanchi’s smooth integration with Google Workspace, your workflow efficiency will level up tremendously.
Collaborating with a remote team is no longer a unique experience. More than a year of the COVID-19 pandemic, and it has become a norm. So, how do you collaborate effectively? A short list of the necessities would be:
transparent and defined work schedule
remote team collaboration software
defined communication channels
clear and realistic deadlines
culture of trust
Let's talk about each in detail.
For some of us, remote working has turned out to be a better option, while others are struggling with it. However, both groups need the same to be as productive as they would have been in the office. Here are the five most essential things you need to incorporate into your team to maintain a high level of efficiency.
1. Transparent and defined work schedule
The main concern in all types of work is availability. Do your team members need to be available and at work simultaneously? If that's not crucial for your work, why not give them the option to decide when they want to work? It shouldn't involve changing their schedules at the last minute, but rather give them the freedom to select their working hours. You will need to start with these simple questions for each of them:
What are their defined working hours they guarantee they are working and available for an urgent call?
When do everyone's working hours overlap, and is this overlapping enough for all necessary team meetings, etc.?
Is it acceptable to call your team members without scheduling the call in advance?
Having this information, you will create your team schedule. Your team members will be aware of the hours they can reach out to a particular person for a one-on-one discussion, as well as the hours reserved for team meetings. It may sound like something very challenging to manage, but in most cases, team members are willing to adjust their working hours to make them suitable for the whole team.
2. Remote team collaboration software
So, you have your team schedule. Now, consider the best tools you have to facilitate collaboration. It's beneficial that you have a variety of online applications available for your team to utilize across different areas of work. Even before the pandemic started, it was probably the case that you did most of your work using online tools.
Companies are turning from traditional approaches to more flexible and agile ones. In terms of technologies as well. On average, each company has a stack of at least 10 digital tools that its workers use daily, including Gmail, apps for video calls, data storage, text, and data processing tools such as Word, Excel, or Google Spreadsheets and Docs. Though there's no question of why we need online collaboration tools, the question is which tool will be the best for my team.
Kanbanchi will suit the needs of Google Workspace users because it's integrated with the Google ecosystem and lives inside your Google Drive.
3. Defined communication channels
Your team should agree on the main communication channel from the very beginning. If you agree, it will eliminate misunderstanding in the future. You might want to use your collaboration software as the priority channel
At the same time, don't avoid using different communication means when it's appropriate. For example, when you need something done urgently, it is hardly effective to send an email and expect a prompt reply. Using instant messenger will be much better in this case. However, don't forget that messengers take their leading place among the disturbing factors at work; use them carefully.
We won't pass by the topic of calls and video calls. It's essential to establish a rule for video calls to avoid becoming overwhelmed with them. It's also very important to know who on your team would not be comfortable with just having a call in the middle of the workday. Notify this person in advance and ask for the best time for a call.
4. Clear and realistic deadlines
Setting clear expectations in advance works out well in any area of life, not only at work. Your entire collaboration process will go smoothly if you start with a proper foundation. Deadlines might be the most dreadful things for one and something that drives the force of the other. In both cases, you need to identify them clearly. Just as you know that goals should be S.M.A.R.T. (Specific, Measurable, Achievable, Relevant, and Time-bound), the deadlines should be as well. There's no sense in a deadline for building a house that comes in a week, or a deadline to make the report "whenever it is needed".
5. Culture of trust
All that has been said above is only possible when you have developed a culture of trust within your team. Then you will surely know that everyone is working towards the team goals, not against them. Such a culture is not something that's built in a day or two, but it's worth it. Transparency in communications and leadership helps to build such a culture. Even the tools you use may help to develop it or ruin it. For example, if you use remote team collaboration software that is flexible and supports everyone's input, you are building a culture of trust.
Try Kanbanchi as the remote team collaboration software
Using the right apps, you can collaborate efficiently. Our platform is designed to support various types of businesses, offering flexibility, agility, and an intuitive user experience. Start now and build your best corporate culture with effective collaboration.
Google offers no project tracker tools to choose from. As we know, Google's broad customer base relies heavily on Gmail, Google Calendar, Google Drive with Docs and Spreadsheets, and Google Meet. However, people are searching for a project tracker tool that would perform its basic functions well while also integrating with Google services.
Numerous companies have switched from sticky notes on a whiteboard to dedicated project tracking software over the past few years. So it's no surprise that project tracker tools have become an essential part of the workflow for so many teams. For those just at the very beginning of their digital project-tracking journey, it is important to understand which key features a proper project-tracking tool should have.
Project tracker tool key features
There are several crucial features that a project tracker should have. Google Workspace users try to find workarounds with the apps available within the suite, and for some teams this may work. Some, however, may want more. We covered this in more detail in our guide to Google Workspace features.
Task management
The team should be able to add tasks, assign them, and choose from different categorization and prioritization options. Easy navigation is definitely very important.
Project scheduling
Google Calendar is a scheduling service for teams on Google Workspace. So a project tracker should be at least integrated with the Calendar. But the ability to see a project on a Gantt chart would be way better. The Gantt chart has proven to be an excellent tool for project planning as it shows project activities on the timeline.
File sharing
Easy access to files is an important aspect of any workflow. You definitely don't want your teammate to spend precious time searching for a file instead of focusing on real work. Google Drive can serve as storage, while a project tracker tool can be your compass, leading you to specific files.
Also, never forget about security. Google allows users to set Viewer/Commenter/Editor access rights. The project tracker tool should never interfere and change these permissions.
Communication
Pretty sure, teams usually use Google Chat or Slack for communication. However, the option to have project-specific communication inside a project tracker tool is also great.
Reporting
Keeping track of project progress through reports is essential. How else will the team know that they are moving in the right direction? Google Data Studio can be used for this purpose. In this case, the team would have an opportunity to export a project to Google Spreadsheets. Even better if the data from the project tracker can be exported and added to Google Data Studio.
Since there is no native Google project-tracking tool, alternatives are available on the market. Kanbanchi is the only tool that integrates with Google services seamlessly and meets all the key features of a project tracker tool.
https://youtu.be/36tKpnoGdtI
Kanbanchi project boards behave as Google files in Google Drive. It is absolutely secure as it has no access to files in Google Drive. And even if a file is attached to a card, Kanbanchi can't read its content but only creates a link between the interface and the file.
Such valuable tools as a Gantt chart, reports, and integration with Google Calendar are also present. And much more. Check it out!
Google Drive is a place where your files are stored in the cloud. Yet, it is not just a storage place for work and home but a suite of valuable tools for collaboration. However, is there a Google Drive task manager?
Google Drive is part of Google Workspace. If you want to read more about applying it to your business, check out our next article about Google Workspace features.
Google Drive for Collaboration
To understand why a task manager matters here, it helps to know what Drive actually offers for teamwork. The pack of Google Docs, Google Sheets, and Google Slides provides a way to collaborate side by side, with changes synced instantly across devices and the cloud.
You have two spaces to locate your data. My Drive stores personal files and folders that you create and own. Shared Drives hold files your team is collaborating on. A great option, especially for larger teams where collaborators need to easily find and access files.
Teams adopting Google Workspace get a solid starter pack of tools for cooperation. But managing projects and keeping track of workflow is a different need, and Drive does not address it natively.
Google Drive Does Not Have a Built-In Task Manager
Google Drive does not have a built-in task manager. For teams that need to go beyond file storage and document collaboration - tracking who owns what, what is in progress, what is blocked, and what is done - you need a dedicated tool that works alongside Drive rather than replacing it.
For a broader look at what Google Workspace offers for task management and where the gaps are, the Google Workspace task management FAQ covers the full picture.
Kanbanchi as a Google Drive Task Manager
Kanbanchi copes with the role of a Google Drive task manager perfectly well. Just like working with Google files, you can observe all the changes made by your team members in real-time on Kanbanchi boards.
When you want to share your Kanbanchi board with your team, you can invite users individually with specific permission levels. The permission levels in Kanbanchi match those you see when sharing any other Google file. Alternatively, you can move your board to a Shared Drive, making it accessible to your whole team exactly as any other shared file would be.
You can also attach files from Google Drive securely. Kanbanchi does not have access to the content of your files; it simply creates links between the interface and your file. So you do not have to worry about the confidentiality of your data. It is only you who decides who has access to the content of your files.
Kanbanchi is a full-featured task management platform that includes a Kanban board, Gantt chart, reports, time tracker, and recurring cards. It integrates seamlessly with Google Drive and creates a secure, organized connection between your tasks and your files, so your project board and your Drive documents always stay in sync.