Growth hacking expert with over 10 years of experience with Kanbanchi
Managing projects efficiently is crucial for any organization. The tools you choose can make or break your workflow. For years, Microsoft Excel has been the go-to solution for project management professionals and teams looking for a flexible, cost-effective way to organize tasks, track progress, and manage resources. However, as projects become more complex, many teams outgrow Excel’s capabilities and search for more powerful, collaborative alternatives.
In this comprehensive guide, we’ll walk you through how to manage projects in Excel – from basic task lists to advanced Gantt charts. You’ll find practical examples, step-by-step instructions, and downloadable templates to get you started. We’ll also explore the limitations of Excel for project management and introduce Kanbanchi – a modern project management app that integrates seamlessly with both Microsoft 365 and Google Workspace.
By the end, you’ll know precisely when Excel is enough, when to upgrade, and how to transition.
What is Excel Project Management?
Excel project management refers to using Microsoft Excel spreadsheets to plan, execute, and monitor projects. This approach leverages Excel’s familiar interface, powerful calculation features, and customizable layouts to help teams organize their work without investing in dedicated project management software.
Who Uses Excel for Project Management?
Small businesses and startups seeking low-cost tools
Project managers handling straightforward or one-off projects
Nonprofits and educational institutions with limited software budgets
Teams already embedded in Microsoft 365
Freelancers and consultants managing multiple clients
Organizations in industries such as construction, marketing, IT, and research
Typical Use Cases
Creating project timelines and schedules
Assigning tasks and tracking completion
Managing budgets and resources
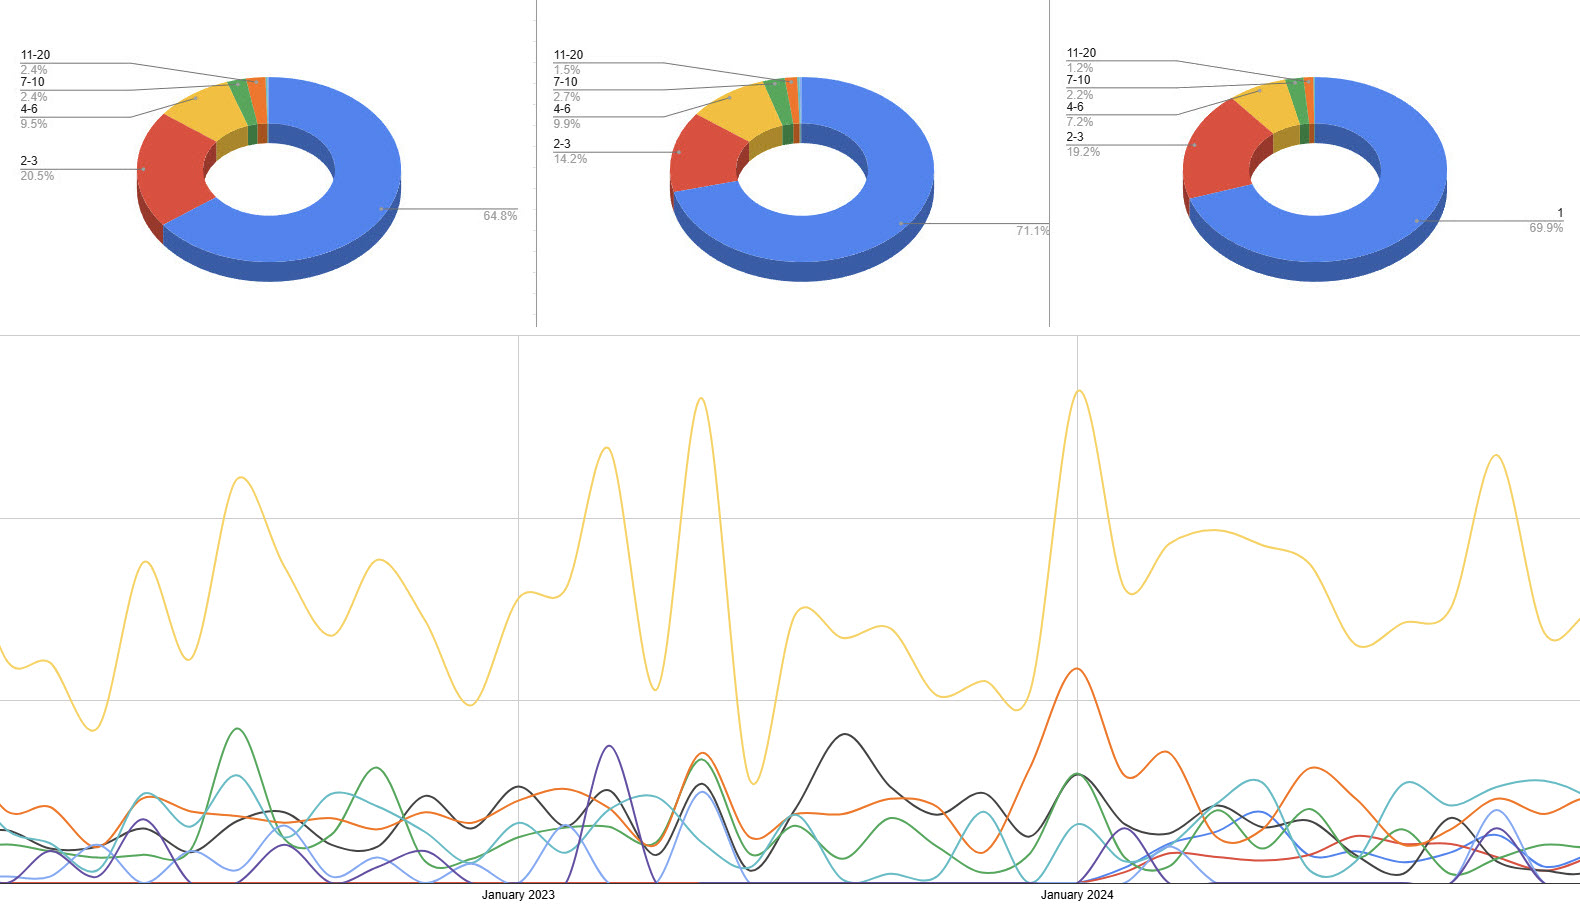
Visualizing progress with charts and dashboards
Reporting to stakeholders
Why Excel?
Familiarity: Most professionals already know how to use Excel.
Flexibility: Spreadsheets can be customized for any workflow.
Accessibility: Included in most Microsoft 365 subscriptions.
Data Analysis: Built-in formulas and charts make reporting easy.
How to Manage Projects in Excel: Step-by-Step Guide
Managing projects in Excel can be as straightforward or sophisticated as you need. Here’s a detailed, step-by-step guide to get you started, with practical examples and expert tips.
1. Setting Up Your Project Spreadsheet
Start by creating a new workbook. A well-structured project spreadsheet should include the following columns:
Task ID: Unique identifier for each task
Task Name: Description of the task
Assigned To: Responsible team member
Start Date: When the task begins
End Date: When the task is due
Duration: Calculated as =End Date – Start Date
Status: Not Started, In Progress, Completed, Blocked
Priority: High, Medium, Low
Dependencies: Tasks that must be completed first
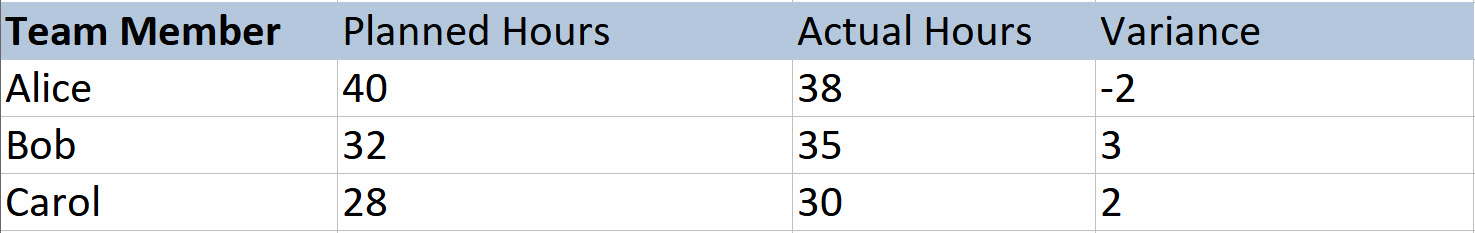
Budgeted Hours/Cost: Planned resource or financial allocation
Actual Hours/Cost: Real resource or financial usage
Notes: Additional comments or links
Tips:
Use Excel’s Data Validation to create drop-downs for Status and Priority.
Freeze the header row for smoother navigation.
Use Conditional Formatting to highlight overdue tasks or critical items.
2. Creating Task Lists and Timelines
A well-organized task list is the backbone of any project plan. To create a timeline:
List all project tasks in the order they should be completed.
Assign realistic start and end dates.
Use formulas to calculate durations and flag overdue items.
Add dependencies to clarify task order.
Sample Timeline Formula:
Duration:=IF(AND(Start Date<>””, End Date<>””), End Date-Start Date, “”)
Overdue Flag:=IF(AND(Status<>”Completed”, End Date<TODAY()), “Overdue”, “”)
Pro Tip: Use Excel’s Filter and Sort features to quickly view tasks by status, priority, or assignee.
3. Using Excel Formulas for Project Tracking
Excel’s real power lies in its formulas. Here are some essential project management formulas:
Advantages and Limitations of Excel Project Management
Advantages
Familiar Interface: Most professionals are comfortable with Excel, reducing the learning curve.
Cost-Effective: Included in Microsoft 365 subscriptions, making it accessible for most organizations.
Customizable: Spreadsheets can be tailored to fit any workflow, from simple to complex.
Data Analysis: Built-in formulas, charts, and PivotTables enable robust reporting.
Offline Access: Work on projects without needing an internet connection.
Integration with Office Suite: Easily link to Word, PowerPoint, and Outlook.
Limitations
Manual Updates: No built-in automation; all changes must be made by hand.
Limited Collaboration: Real-time editing is basic; version control can be problematic, especially when multiple contributors are involved.
No Real-Time Sync: Changes aren’t instantly visible to all users unless they are using cloud storage, such as OneDrive.
Scalability Issues: Managing large or complex projects becomes unwieldy as spreadsheets become increasingly complex.
Reporting Constraints: Advanced reporting requires significant manual setup and maintenance.
Lack of Integration: Difficult to connect with other business tools or automate workflows.
Error-Prone: Manual data entry increases the risk of mistakes, which can have serious project consequences.
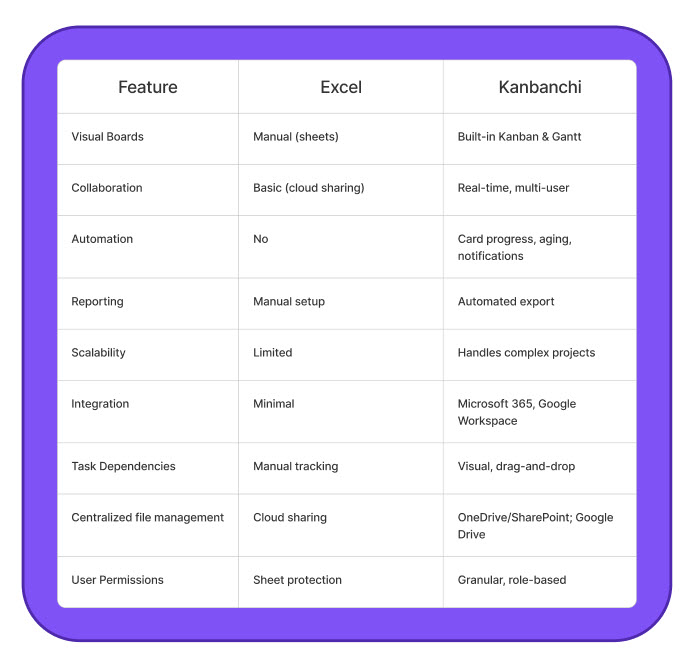
Excel vs. Professional Project Management Tools
As your projects and teams grow, you may find Excel’s limitations outweigh its benefits. Here’s how Excel stacks up against dedicated project management tools like Kanbanchi:
When Excel Works Best
Small, simple projects
Solo professionals or small teams
Projects with minimal collaboration needs
Tight budgets
When to Consider Another Project Management App
Growing teams or organizations
Projects with complex dependencies or multiple phases
Need for automation, notifications, or advanced reporting
Desire for seamless integration with Microsoft 365, Google Workspace, or other business tools
Kanbanchi: The Better Alternative to Excel Project Management
Kanbanchi is a modern, visual project management app designed for teams that need more power, flexibility, and collaboration than Excel can offer. Here’s why Kanbanchi is the ideal upgrade for Excel users:
What is Kanbanchi?
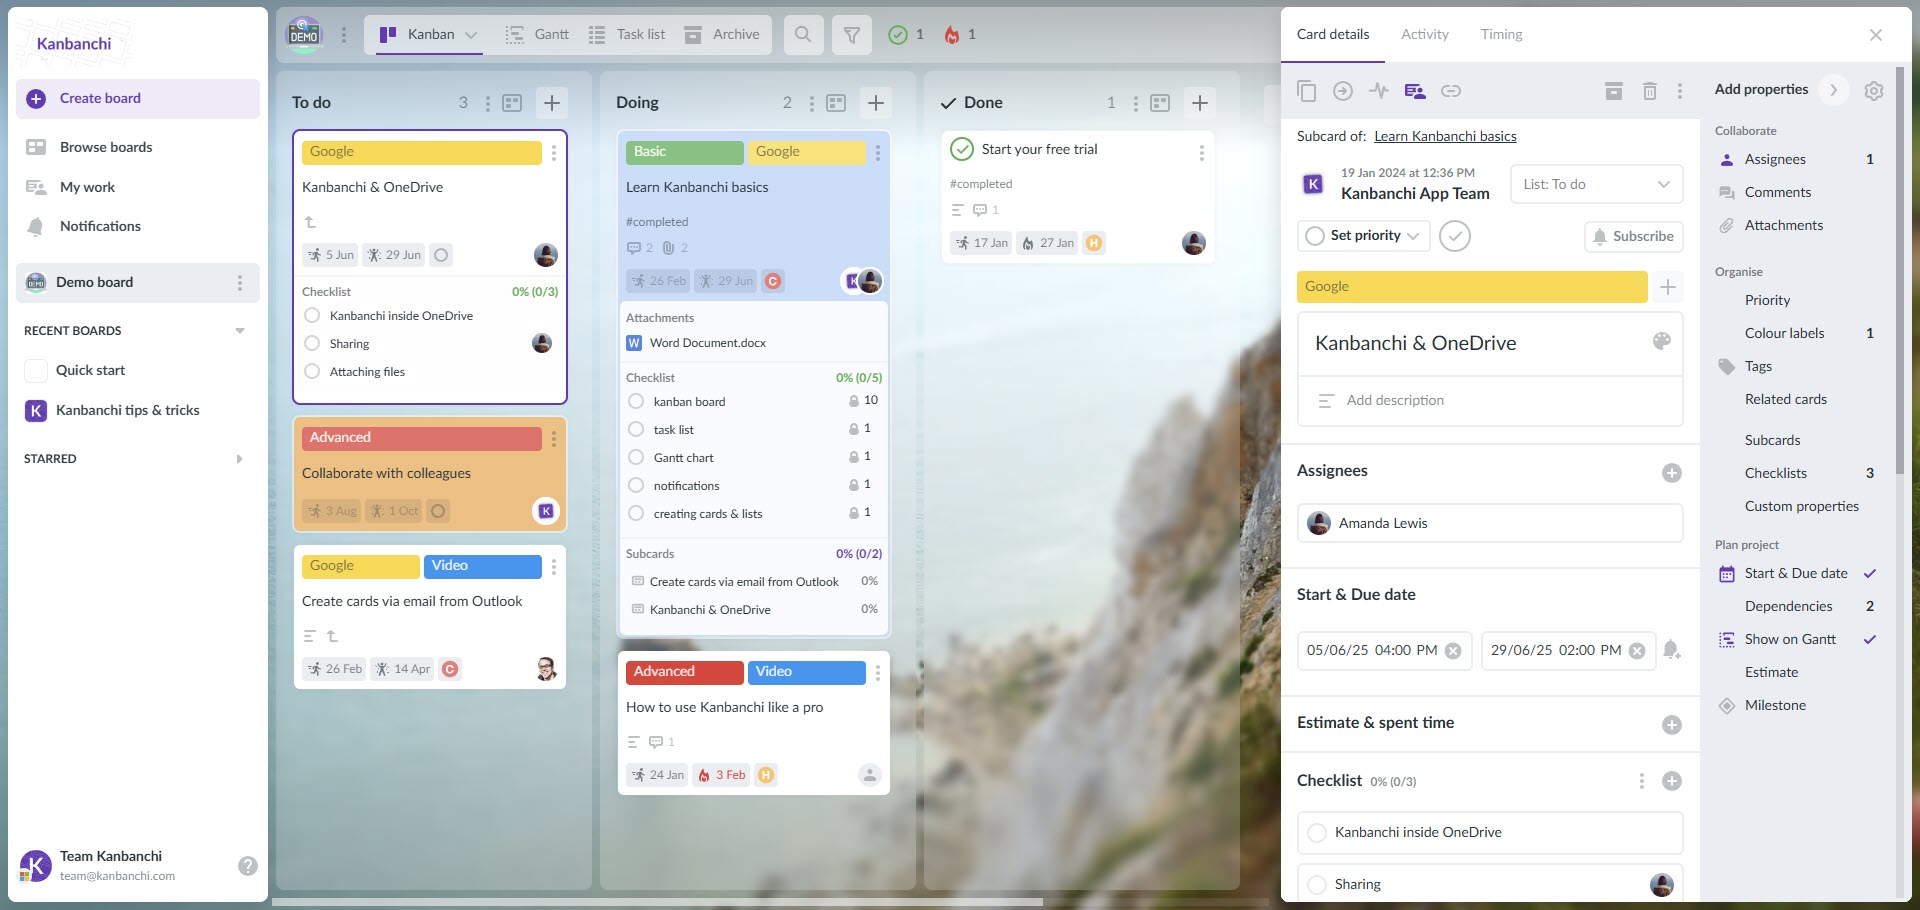
Kanbanchi is a web-based project management solution that offers:
Kanban Boards: Visualize tasks and workflows in columns (To Do, In Progress, Done)
Gantt Charts: Plan timelines, dependencies, and milestones
Time Tracking: Monitor hours spent on tasks and projects
Automation: Set up reminders, notifications, and recurring tasks
Real-Time Collaboration: Multiple users can update boards simultaneously
Seamless Integration: Works within both Microsoft 365 and Google Workspace environments
Key Benefits of Kanbanchi Over Excel
Visual Management: Drag-and-drop tasks, customize boards, and see project status at a glance.
Collaboration: Real-time updates, comments, and file attachments keep everyone on the same page.
Automation: Reduce manual work with built-in notifications and recurring tasks.
Advanced Reporting: Automated dashboards and charts for instant insights.
Integration: Connect with Microsoft 365, Google Workspace, and other tools for a unified workflow.
Export Capabilities: Easily export boards to Excel or Google Sheets for sharing or backup.
Microsoft 365 Integration with Kanbanchi
Kanbanchi is compatible with Microsoft 365, offering:
Single Sign-On: Use your Microsoft account to log in.
OneDrive/SharePoint Integration: Attach and share files directly from OneDrive/SharePoint.
Excel Export: Export project data to Excel for reporting or archiving.
Outlook: Create Kanbanchi cards from emails in your inbox.
Google Workspace Compatibility
Kanbanchi is also deeply integrated with Google Workspace:
Google Drive Attachments: Link files and folders to tasks.
Google Calendar Sync: Schedule tasks and deadlines with calendar events.
Google Sheets Export: Export boards for custom reporting or analysis.
Gmail add-on: Convert any email into Kanbanchi cards in one click.
Marketplace App: Install Kanbanchi directly from the Google Workspace Marketplace.
From Excel to Kanbanchi: Migration Guide
Transitioning from Excel to Kanbanchi is straightforward, ensuring your team doesn’t lose valuable data or momentum.
Step 1: Export Your Excel Data
Save your project spreadsheet as a CSV or XLSX file.
Step 2: Import or Copy Data into Kanbanchi
Use Kanbanchi’s import feature or manually copy tasks into your new board.
Set up columns (e.g., Backlog, In Progress, Done) to match your workflow.
Step 3: Assign Tasks and Set Deadlines
Add team members to your Kanbanchi board.
Assign tasks, set priorities, and add due dates.
Step 4: Customize Your Boards
Add labels, checklists, and attachments.
Set up automations for recurring tasks or reminders.
Step 5: Train Your Team
Share Kanbanchi’s help documentation and video tutorials.
Hold a kickoff meeting to walk through the new system and review its features.
Step 6: Leverage Export Features
Export Kanbanchi boards to Excel or Google Sheets as needed for reporting or sharing.
Excel remains a powerful and flexible tool for basic project management, especially for small teams and straightforward projects. However, as your needs grow, Excel’s manual processes, collaboration limitations, and lack of automation can hinder your progress. That’s where Kanbanchi comes in.
With Kanbanchi, you get visual boards, real-time collaboration, automation, and deep integration with both Microsoft 365 and Google Workspace. Migrating from Excel is simple, and your team will quickly reap the benefits of increased efficiency, transparency, and scalability.
Transform your project management from static spreadsheets to dynamic, visual boards. Sign up for a free trial of Kanbanchi and discover how it seamlessly integrates with your preferred Microsoft 365 and Google Workspace tools.
Growth hacking expert with over 10 years of experience with Kanbanchi
Olga wears multiple hats across marketing, sales, product, and ops after 10+ years in the SaaS world. She is passionate about helping teams streamline their workflows with Kanbanchi and Google Workspace or Microsoft 365. "When I'm not optimizing processes or writing guides, I'm probably tweaking our product roadmap or diving into the latest productivity tools".
Buy and manage subscriptions, distribute seats for your team members, control subscription status (current number of seats and expiration date) right in the app.
What is Kanban project management? Master core principles, WIP limits, and boost team efficiency with this complete guide to using Kanbanchi in Google Workspace and beyond.